Fig. 8
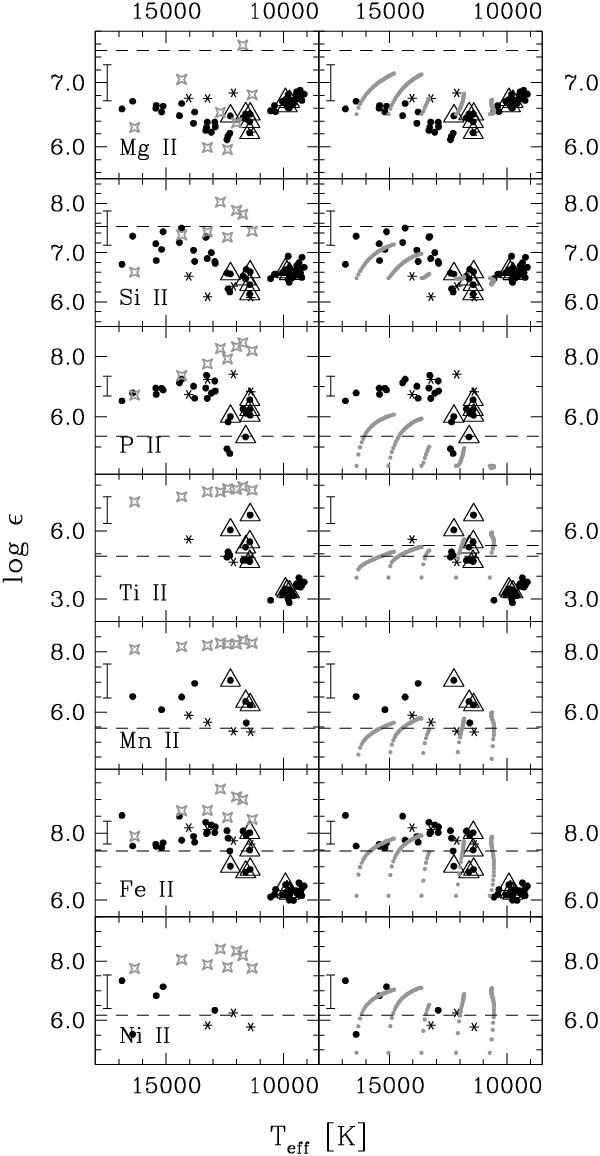
Abundances derived via spectrum synthesis for all stars hotter than 9000 K. The triangles mark the same stars as in Fig. 1. The asterisks mark the results from Behr (2003). The bars at 17 500 K mark the average error bars of Behr (2003) for NGC 288. Our errors are probably not smaller. The dashed lines mark the solar abundances. The four-pointed stars mark the abundances derived for stratified model spectra (left column, see Sect. 6.3 for details), which indicate the equilibrium abundances achievable by diffusion. The grey dots (right column) mark the abundances predicted for various HB ages from diffusion theory (with an ad hoc surface-mixing zone, Michaud et al. 2011, see Sect. 6.4 for details). The tracks have dots every 1 Myr.
Current usage metrics show cumulative count of Article Views (full-text article views including HTML views, PDF and ePub downloads, according to the available data) and Abstracts Views on Vision4Press platform.
Data correspond to usage on the plateform after 2015. The current usage metrics is available 48-96 hours after online publication and is updated daily on week days.
Initial download of the metrics may take a while.