Fig. 2
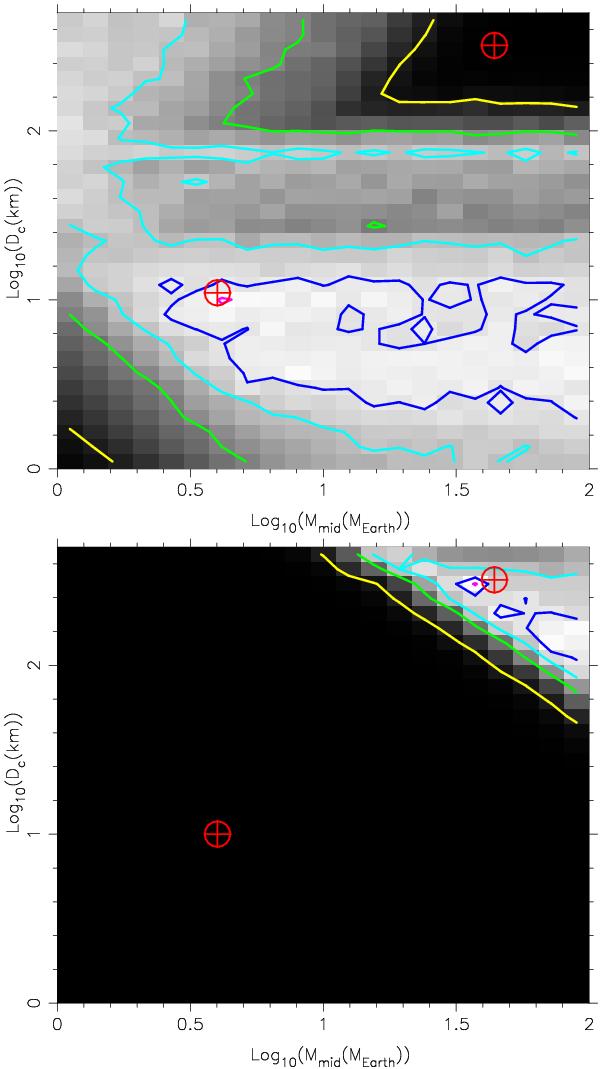
Tests of the fitting procedure with simulated data. Top: parameter search for data simulated with Mmid = 4 M⊕, Dc = 10 km, R1 = 6.5 AU, R2 = 35 AU. Bottom: parameter search for data simulated with Mmid = 40 M⊕, Dc = 350 km, and R1 and R2 as just mentioned. Levels are 99% (red), 90% (dark blue), 75% (light blue), 50% (green) and 10% (yellow). The two best-fit regions delineated by the 90% contour are clearly exclusive when comparing the two plots. Their peaks are close to the a priori values of Mmid and Dc. The two crossed circle symbols on each plot indicate the positions of the a priori values used for Mmid and Dc to simulate the two sets of data.
Current usage metrics show cumulative count of Article Views (full-text article views including HTML views, PDF and ePub downloads, according to the available data) and Abstracts Views on Vision4Press platform.
Data correspond to usage on the plateform after 2015. The current usage metrics is available 48-96 hours after online publication and is updated daily on week days.
Initial download of the metrics may take a while.