Fig. 1
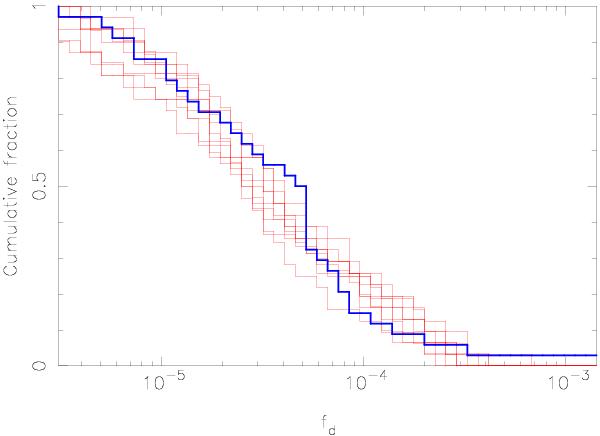
Cumulative distributions of the fractional dust luminosities; the blue line corresponds to the observations and the red lines are eight independent simulations computed with the same parameters Mmid, R1, R2, and Dc, but with different random numbers to simulate the disk population around the A stars of the Su et al. (2006) survey. The statistical Kolmogorov-Smirnov test is used to match the observed and simulated distributions so they can be considered drawn from the same parent distribution. The maximum K-S probability is 75% in this example, averaged over 100 simulations. For clarity, only eight simulations are shown on this figure but 100 were actually computed at each point of the 4D parameter space (Mmid, R1, R2, Dc) for our numerical search.
Current usage metrics show cumulative count of Article Views (full-text article views including HTML views, PDF and ePub downloads, according to the available data) and Abstracts Views on Vision4Press platform.
Data correspond to usage on the plateform after 2015. The current usage metrics is available 48-96 hours after online publication and is updated daily on week days.
Initial download of the metrics may take a while.