Press Release
Free Access
Fig. 8
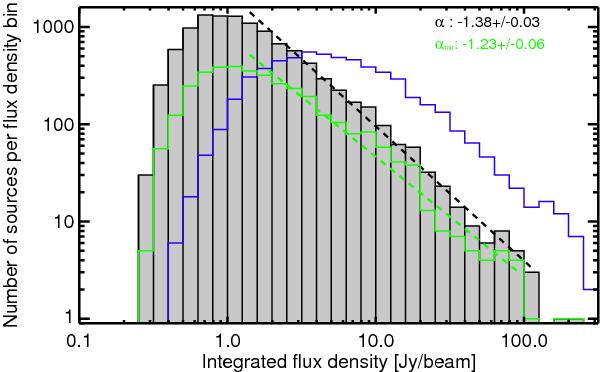
Distribution of the integrated flux density of the detected sources. The black dashed line shows the measured slope of the distribution, green is the same distribution for the star-forming ATLASGAL clumps (see Sect. 5 for details). The blue histogram shows the sources from Contreras et al. (2013).
Current usage metrics show cumulative count of Article Views (full-text article views including HTML views, PDF and ePub downloads, according to the available data) and Abstracts Views on Vision4Press platform.
Data correspond to usage on the plateform after 2015. The current usage metrics is available 48-96 hours after online publication and is updated daily on week days.
Initial download of the metrics may take a while.