Fig. 7
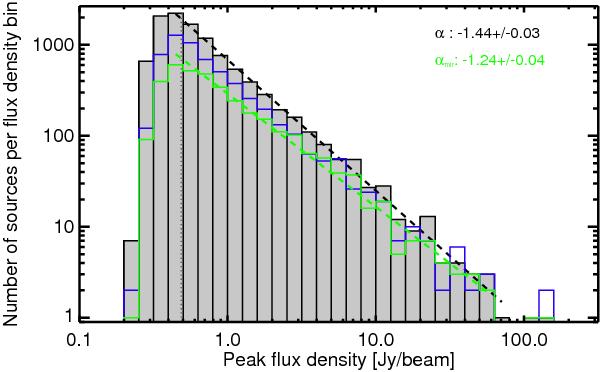
Distribution of the peak flux density of the detected sources. The ATLASGAL sources from the current paper are shown in the black histogram with gray. The blue line shows the sources from Contreras et al. (2013). The black dashed line shows the measured slope of the distribution, and green indicates the star-forming ATLASGAL clumps (see Sect. 5 for details). A black dotted line corresponds to our 7σ completeness limit when using an average of 70 mJy/beam noise level. The fits to the slope of the distributions are shown in dashed colored lines. We note that here we show the source count per bin, while in Rosolowsky et al. (2010) and Contreras et al. (2013) the differential source count, ΔN/ ΔFν is shown.
Current usage metrics show cumulative count of Article Views (full-text article views including HTML views, PDF and ePub downloads, according to the available data) and Abstracts Views on Vision4Press platform.
Data correspond to usage on the plateform after 2015. The current usage metrics is available 48-96 hours after online publication and is updated daily on week days.
Initial download of the metrics may take a while.