Press Release
Free Access
Fig. 5
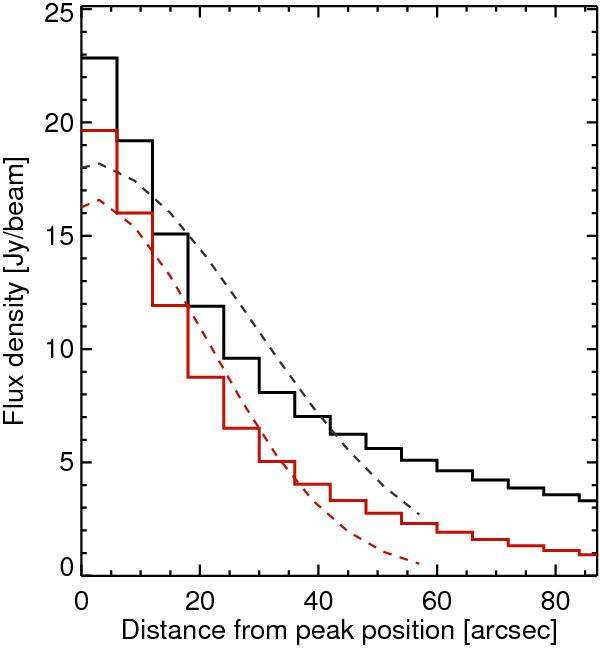
Azimuthally averaged emission profile averaged over the 100 brightest sources. The black line corresponds to the original images, while the red line shows the images filtered above the 100′′ scale. Dashed lines show the Gaussian fits to these profiles.
Current usage metrics show cumulative count of Article Views (full-text article views including HTML views, PDF and ePub downloads, according to the available data) and Abstracts Views on Vision4Press platform.
Data correspond to usage on the plateform after 2015. The current usage metrics is available 48-96 hours after online publication and is updated daily on week days.
Initial download of the metrics may take a while.