Fig. A.2
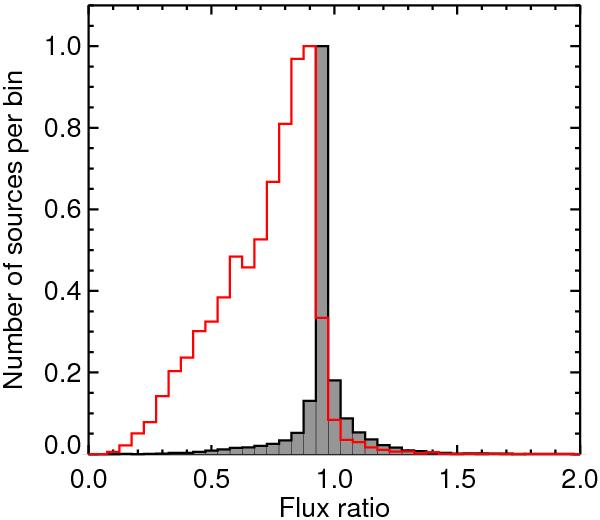
Normalized ratio of peak flux density calculated from the extracted (i.e. fitted) and the actual pixel values at the position of the source. Black histogram shows the ratio calculated using the filtered maps, while the red line shows the ratio calculated from the original maps with the total emission. (See Sect. A.2 for discussion.)
Current usage metrics show cumulative count of Article Views (full-text article views including HTML views, PDF and ePub downloads, according to the available data) and Abstracts Views on Vision4Press platform.
Data correspond to usage on the plateform after 2015. The current usage metrics is available 48-96 hours after online publication and is updated daily on week days.
Initial download of the metrics may take a while.