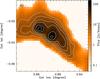
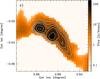
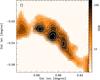
Fig. 2
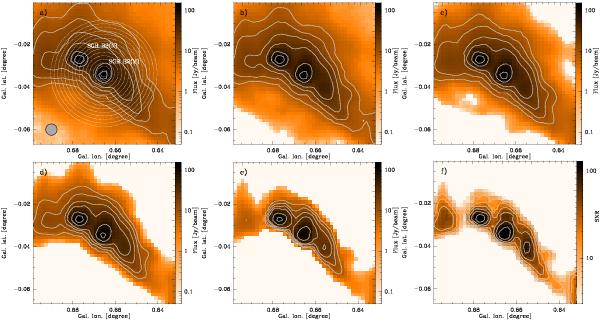
Example of the multiscale decomposition towards the brightest region at 870 μm in the whole survey, which hosts SgrB2(N) and SgrB2(M). The impact of flux loss due to filtering is the most severe towards this region. Contours start at 7.5 Jy/beam and increase on a logarithmic scale to 120 Jy/beam. Dotted circles mark the regions where the radial averaging has been done (see Sect. 3.3 and Fig. 5 for details). The beam size of 19.2′′ is shown in panel a). Panels a) to e) show maps with different scales of filtering: from no filtering to maps where background emission is increasingly removed. The catalog is generated from a filtering level corresponding to the e) panel, where emission until 2×50′′ scales is summed up. The peak flux density of the object in this case decreases by 20% from the original images to the most compact one, while the size decreases by only 10%. The f) panel shows the filtered S/N map used as the input for the source extraction algorithm containing the same spatial scales as the e) panel. The scaling is logarithmic between 3−120σ, contours start at 7σ increasing on a logarithmic scale.
Current usage metrics show cumulative count of Article Views (full-text article views including HTML views, PDF and ePub downloads, according to the available data) and Abstracts Views on Vision4Press platform.
Data correspond to usage on the plateform after 2015. The current usage metrics is available 48-96 hours after online publication and is updated daily on week days.
Initial download of the metrics may take a while.