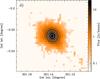
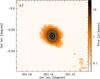
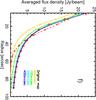
Fig. A.1
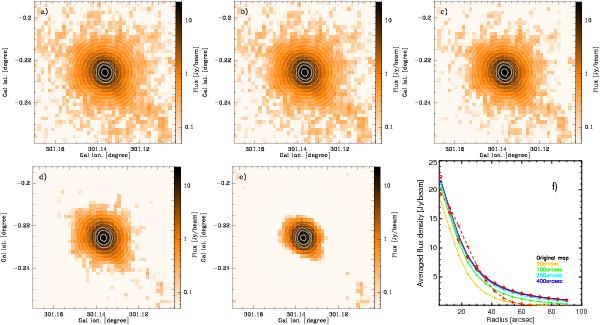
One of the brightest sources detected shown with different scales of filtering, similarly as in Fig. 2. The peak flux of the object in this case decreases by 20% from the original images to the most compact one, while the size decreases by only 10%. Panel f) shows azimuthally averaged flux density profile with different scales of background emission removed. The green line corresponds to the filtering used for our catalog, which has 2 × 50′′ as maximum scale. As a comparison a Gaussian profile is indicated in red dashed line with crosses and a dotted line with diamond symbols shows a power-law fit.
Current usage metrics show cumulative count of Article Views (full-text article views including HTML views, PDF and ePub downloads, according to the available data) and Abstracts Views on Vision4Press platform.
Data correspond to usage on the plateform after 2015. The current usage metrics is available 48-96 hours after online publication and is updated daily on week days.
Initial download of the metrics may take a while.