Fig. 16
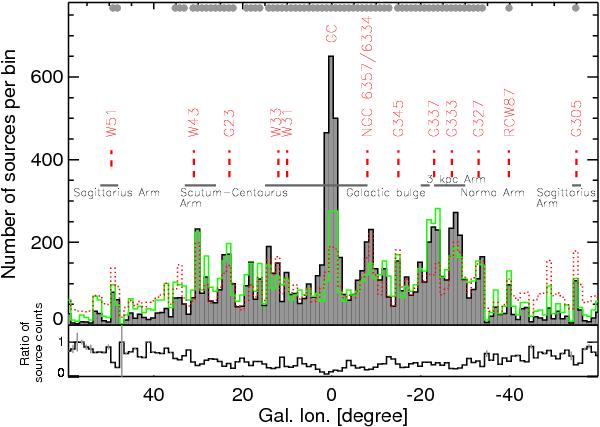
Top: distribution of the ATLASGAL sources in Galactic longitude binned in 1°. Gray lines indicate the spiral arms and the dust complexes are labeled in red. Gray dots in the upper line of the panel show the bins with >7σ peaks. The green line shows the distribution of star-forming ATLASGAL sources and have been scaled to the dust source counts. Red dotted line shows the WISE selected red sources according to the color criteria (see text for details). Bottom: the distribution of the ratio of star-forming to quiescent ATLASGAL sources is shown in black. Error bars in gray indicate the propagated Poisson error from the two distributions.
Current usage metrics show cumulative count of Article Views (full-text article views including HTML views, PDF and ePub downloads, according to the available data) and Abstracts Views on Vision4Press platform.
Data correspond to usage on the plateform after 2015. The current usage metrics is available 48-96 hours after online publication and is updated daily on week days.
Initial download of the metrics may take a while.