Press Release
Free Access
Fig. 13
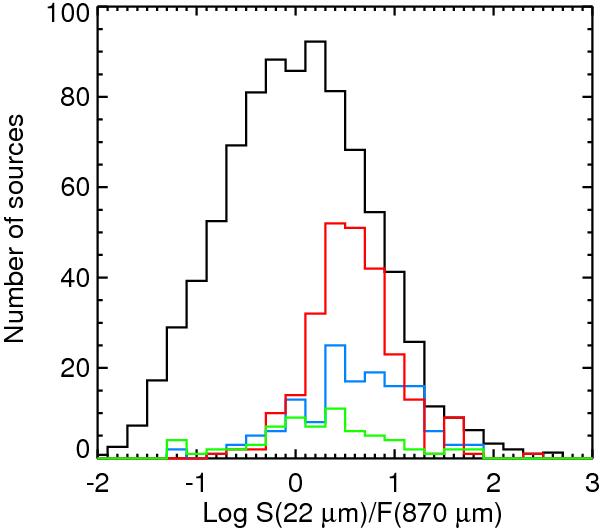
Histogram of the ratio of 22 μm and 870 μm peak fluxes. The black line shows the whole sample (scaled down by a factor of 4), red line shows the RMS associations, blue corresponds to the CORNISH sources, while green indicates the MMB sample.
Current usage metrics show cumulative count of Article Views (full-text article views including HTML views, PDF and ePub downloads, according to the available data) and Abstracts Views on Vision4Press platform.
Data correspond to usage on the plateform after 2015. The current usage metrics is available 48-96 hours after online publication and is updated daily on week days.
Initial download of the metrics may take a while.