Fig. 12
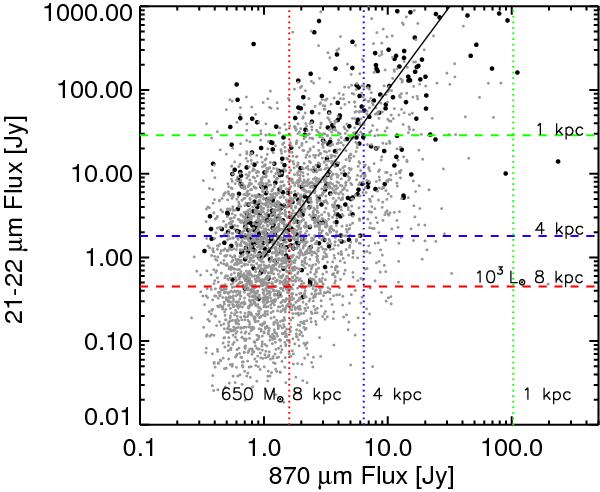
Integrated flux density from ATLASGAL versus the flux density at 22 μm. Gray dots show the WISE, and black dots show the flux measurement from MSX associations. For sources found in both the WISE and MSX catalogs, only the WISE flux is shown. The brightest sources tend to have higher 22 μm flux (see text for more details). Dashed lines show the flux limit at 22 μm corresponding to a B3 protostar at 1, 4, and 8 kpc. The mass limit for high-mass star-forming clumps at the same distances is shown with dotted lines. The black solid line shows a relation of  .
.
Current usage metrics show cumulative count of Article Views (full-text article views including HTML views, PDF and ePub downloads, according to the available data) and Abstracts Views on Vision4Press platform.
Data correspond to usage on the plateform after 2015. The current usage metrics is available 48-96 hours after online publication and is updated daily on week days.
Initial download of the metrics may take a while.