Fig. 10
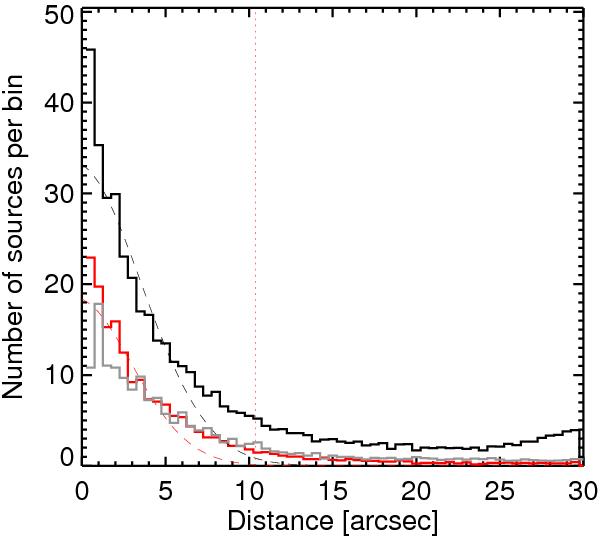
Distribution of the normalized distance between the dust continuum peaks and the mid-infrared sources within 30′′. Black line shows all sources from the WISE catalog, while the red line corresponds to the distribution of only the red sources (see text for details). As a comparison the same distribution for all MSX sources is shown in gray. Dashed lines show the Gaussian fits to these distributions, the maximum angular distance between mid-infrared sources, and ATLASGAL sources was determined as 3σ from this and is shown with a dashed line.
Current usage metrics show cumulative count of Article Views (full-text article views including HTML views, PDF and ePub downloads, according to the available data) and Abstracts Views on Vision4Press platform.
Data correspond to usage on the plateform after 2015. The current usage metrics is available 48-96 hours after online publication and is updated daily on week days.
Initial download of the metrics may take a while.