Fig. 1
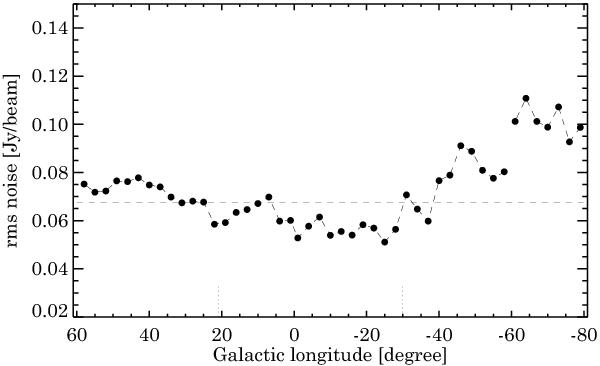
rms noise level determined on the individual tiles of maps using a Gaussian fitting to the distribution of the pixel values between |b| ≤ 1°. The region analyzed in Contreras et al. (2013) is indicated by dotted lines. The horizontal dashed line shows the average 0.07 Jy/beam noise level for the main part of the survey (|ℓ| ≤ 60°).
Current usage metrics show cumulative count of Article Views (full-text article views including HTML views, PDF and ePub downloads, according to the available data) and Abstracts Views on Vision4Press platform.
Data correspond to usage on the plateform after 2015. The current usage metrics is available 48-96 hours after online publication and is updated daily on week days.
Initial download of the metrics may take a while.