Fig. 9
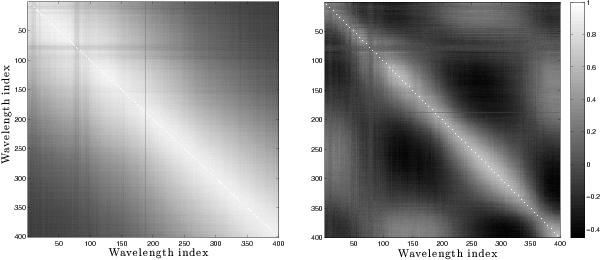
Examples of matrices of the temporal correlation coefficients between spectral channels (see Eq. (8)) for dataset UT-MT-NoFT, averaged over observation files and over the three baselines. Left:  , no correction of the piston effect. Right:
  after piston-fit correction. The value of each correlation coefficient is proportional to the gray scale (far right).
Current usage metrics show cumulative count of Article Views (full-text article views including HTML views, PDF and ePub downloads, according to the available data) and Abstracts Views on Vision4Press platform.
Data correspond to usage on the plateform after 2015. The current usage metrics is available 48-96 hours after online publication and is updated daily on week days.
Initial download of the metrics may take a while.