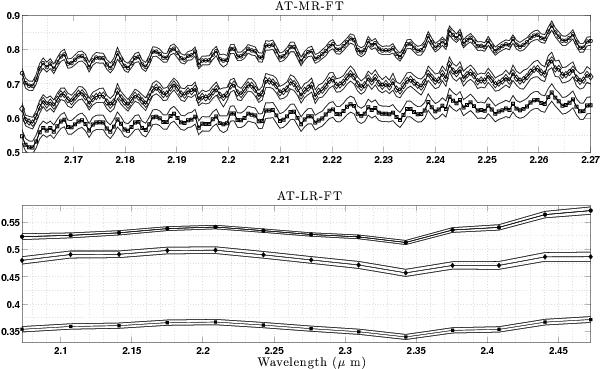
Fig. 5

Average values of squared visibilities and rescaled differential squared visibilities with their standard deviations per file for Baseline 1 of our datasets AT-MR-FT (top) and AT-LR-FR (bottom). Squared visibilities are plotted for frame selection levels of 100% and 20% (square and diamond symbols, respectively). Rescaled differential squared visibility  (circle) are shifted for more clarity by vertical offsets of 0.1 and were obtained using almost 100% of the frames (see Sect. 4.1). In each case, the lines above and below the average values of squared visibility indicate the values of its standard deviation
  over one observation file, which are consistent with
  computed over the whole set of files, as shown in Fig. 6 and in Table 2. This figure is an illustration that shows that differential squared visibility has a very similar shape as the absolute ones but with a lower statistical dispersion.
Current usage metrics show cumulative count of Article Views (full-text article views including HTML views, PDF and ePub downloads, according to the available data) and Abstracts Views on Vision4Press platform.
Data correspond to usage on the plateform after 2015. The current usage metrics is available 48-96 hours after online publication and is updated daily on week days.
Initial download of the metrics may take a while.


