Fig. 2
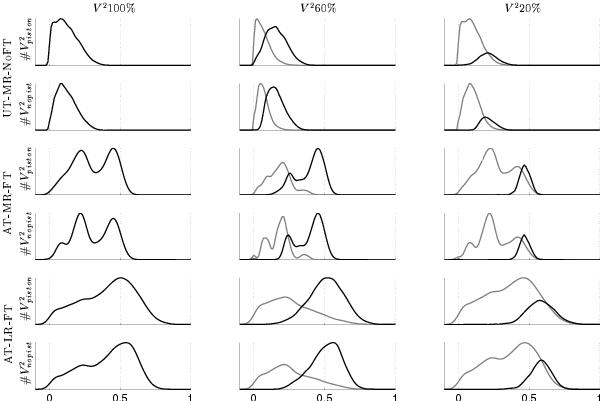
From top to bottom, examples of histograms of  for datasets UT-MR-NoFT, AT-MR-FT and AT-LR-FT. The columns correspond to different threshold levels for the selection of the frames (from left to right: no selection, 60% and 20% of the total number of frames). For each dataset and selection rate, histograms are given with (
 ) and without (
 ) a correction by a quadratic fit. The grey thin curves a in solid line represent the unselected part of the data.
Current usage metrics show cumulative count of Article Views (full-text article views including HTML views, PDF and ePub downloads, according to the available data) and Abstracts Views on Vision4Press platform.
Data correspond to usage on the plateform after 2015. The current usage metrics is available 48-96 hours after online publication and is updated daily on week days.
Initial download of the metrics may take a while.