Fig. 7
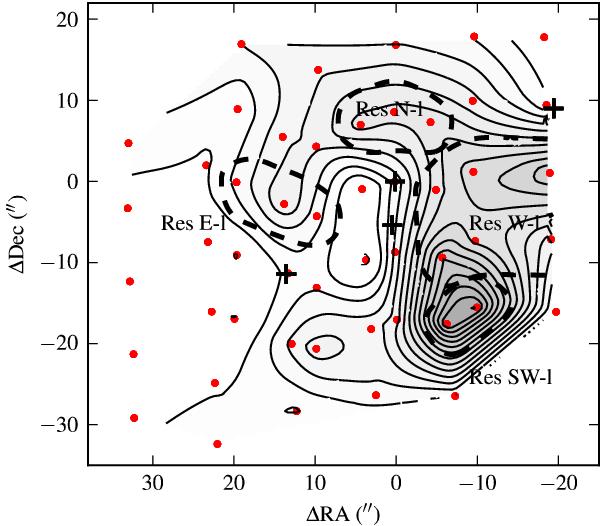
The dashed lines illustrate our definition of the four extended (residual) regions Res SW-l, Res E-l, Res N-l, and Res W-l in IRS7 CO and OH. The contour map shows the CO J = 19 → 18 residual map. The red dots show the PACS spaxel centres. Contours are 3σ = 1.55 × 10⁻¹⁷ W m-2.
Current usage metrics show cumulative count of Article Views (full-text article views including HTML views, PDF and ePub downloads, according to the available data) and Abstracts Views on Vision4Press platform.
Data correspond to usage on the plateform after 2015. The current usage metrics is available 48-96 hours after online publication and is updated daily on week days.
Initial download of the metrics may take a while.