Fig. 6
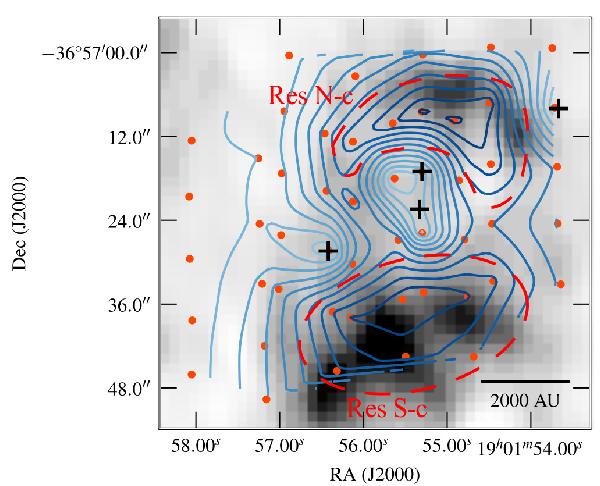
The 110 μm continuum residual map (coloured contours) of IRS7 overplotted on the H2CO 303 → 202 emission (greyscale) from SMA+APEX observations (Lindberg & Jørgensen 2012). The orange dots show the PACS spaxel centres. Contour levels are at 5 Jy intervals and go from light blue to dark blue as the level of emission increases (i.e. the residual emission is at a minimum near the centre of the figure). The red dashed lines illustrate our definition of the two extended (residual) ridge regions (Res N-c and Res S-c) in IRS7 continuum. The crosses show the point sources used for the deconvolution.
Current usage metrics show cumulative count of Article Views (full-text article views including HTML views, PDF and ePub downloads, according to the available data) and Abstracts Views on Vision4Press platform.
Data correspond to usage on the plateform after 2015. The current usage metrics is available 48-96 hours after online publication and is updated daily on week days.
Initial download of the metrics may take a while.