Fig. 5
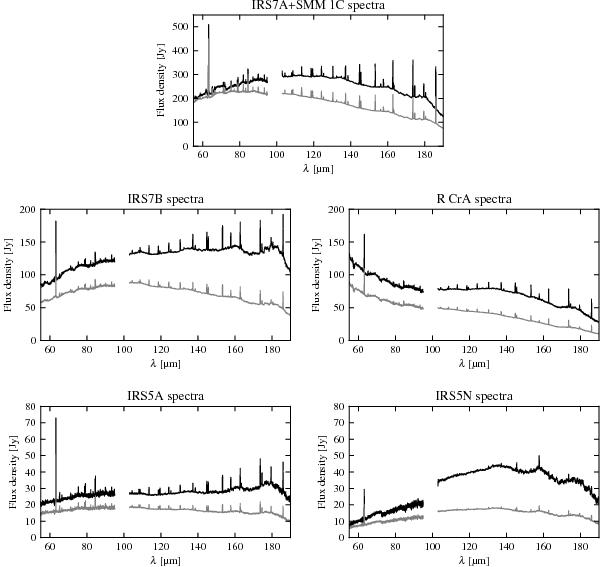
Spectra of the deconvolved point-source emission (black) and the non-deconvolved data (grey). We note that since the flux density in the line channels are sums of the line and continuum flux densities, these will not be properly cleaned (line strengths are under-estimated in these spectra owing to the more extended continuum). The deconvolved spectra shown here are used to check for consistency with the continuum deconvolution (see Sect. 3.2), but not for extracting line fluxes (see Sect. 3.3 for a description of the method used for the line flux deconvolution).
Current usage metrics show cumulative count of Article Views (full-text article views including HTML views, PDF and ePub downloads, according to the available data) and Abstracts Views on Vision4Press platform.
Data correspond to usage on the plateform after 2015. The current usage metrics is available 48-96 hours after online publication and is updated daily on week days.
Initial download of the metrics may take a while.