Fig. 4
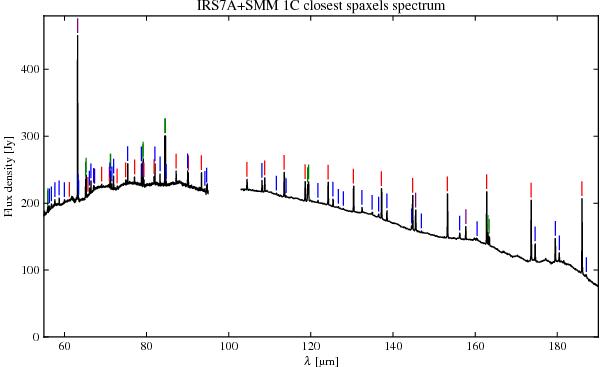
Sum of the spectra of the spaxels closest to IRS7A and SMM 1C. No deconvolution or correction factors have been applied to the spectrum. It thus appears fainter in the red part compared to the true spectrum. The coloured vertical lines indicate the detected spectral line species: CO (red), OH (green), H2O (blue), and atomic species (purple).
Current usage metrics show cumulative count of Article Views (full-text article views including HTML views, PDF and ePub downloads, according to the available data) and Abstracts Views on Vision4Press platform.
Data correspond to usage on the plateform after 2015. The current usage metrics is available 48-96 hours after online publication and is updated daily on week days.
Initial download of the metrics may take a while.