Fig. 3
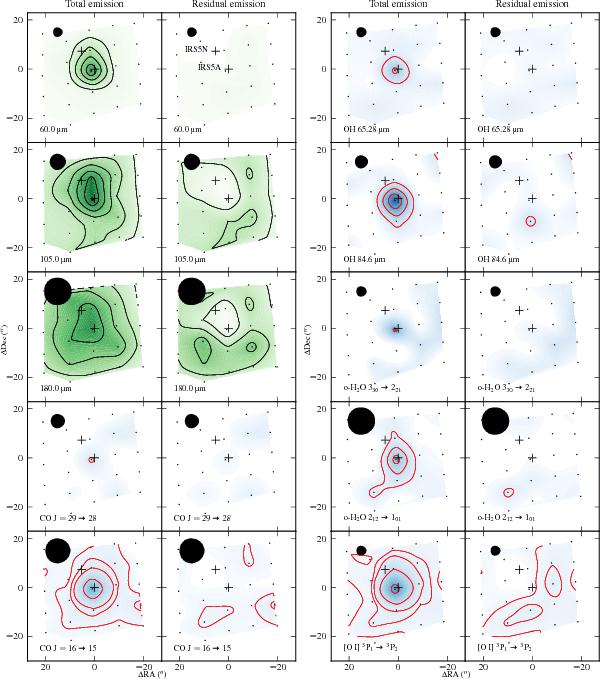
As in Fig. 2, but for IRS5. Contour levels are at 3 Jy for the continuum maps, and as in Fig. 2 for the line maps. The blue colour maps have the same ranges for each separate molecule, with maximum fluxes of 1.5 × 10⁻¹⁶ W m-2 for CO, 2 × 10-16 W m-2 for OH, 1 × 10-16 W m-2 for o-H2O, and 2 × 10-15 W m-2 for [O i].
Current usage metrics show cumulative count of Article Views (full-text article views including HTML views, PDF and ePub downloads, according to the available data) and Abstracts Views on Vision4Press platform.
Data correspond to usage on the plateform after 2015. The current usage metrics is available 48-96 hours after online publication and is updated daily on week days.
Initial download of the metrics may take a while.