Fig. B.9
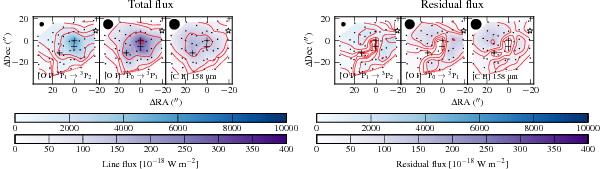
Atomic line maps of the IRS7 region. Left: total flux map. Right: residual map. Contour levels as in Fig. B.1. The blue colour scale is used for the [O i] 63 μm map and the purple colour scale for the [O i] 146 μm and [C ii] 158 μm maps. The Herschel PSF for each observation is shown in the top left corner.
Current usage metrics show cumulative count of Article Views (full-text article views including HTML views, PDF and ePub downloads, according to the available data) and Abstracts Views on Vision4Press platform.
Data correspond to usage on the plateform after 2015. The current usage metrics is available 48-96 hours after online publication and is updated daily on week days.
Initial download of the metrics may take a while.