Fig. 2
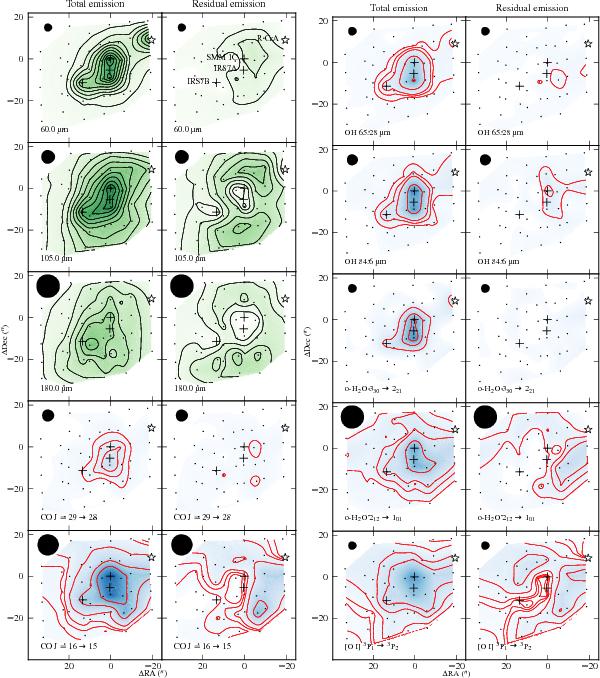
IRS7 contour maps of continuum emission at three wavelengths (green with black contours), and some important spectral lines (the same as in Table 4 of Green et al. 2013, blue with red contours). The first column in each panel shows the total emission, whereas the second column in each panel shows the residual emission after deconvolution (emission not associated with the point sources). These maps of the whole band of continuum and all spectral lines can be found in Appendices A and B. The point sources used for the deconvolution are marked with crosses, except for R CrA which is marked with a star symbol (the sources are identified in the top row). The dots indicate the PACS spaxel centres. The Herschel PSF for each observation is shown in the top left corner. Contour levels are at 10 Jy for the continuum maps, and at 5σ, 10σ, 15σ, 30σ, 60σ, and 90σ for the line maps. The blue colour maps have the same ranges for each separate molecule, with maximum fluxes of 7 × 10-16 W m-2 for CO, 1 × 10-15 W m-2 for OH, 4 × 10-16 W m-2 for o-H2O, and 1 × 10-14 W m-2 for [O i].
Current usage metrics show cumulative count of Article Views (full-text article views including HTML views, PDF and ePub downloads, according to the available data) and Abstracts Views on Vision4Press platform.
Data correspond to usage on the plateform after 2015. The current usage metrics is available 48-96 hours after online publication and is updated daily on week days.
Initial download of the metrics may take a while.