Fig. 18
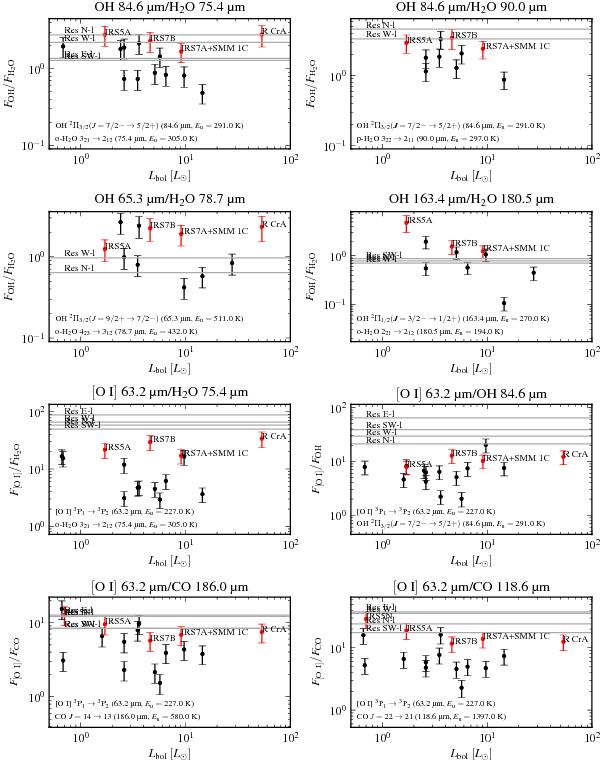
Ratios of [O i], OH, H2O, and CO lines plotted versus the bolometric luminosities of the sources. See details in the figures. The CrA point sources are marked with red; the black data points are other DIGIT embedded sources (Green et al. 2013). The CrA extended emission regions are marked with grey lines. Only data points where both lines are significantly detected are included.
Current usage metrics show cumulative count of Article Views (full-text article views including HTML views, PDF and ePub downloads, according to the available data) and Abstracts Views on Vision4Press platform.
Data correspond to usage on the plateform after 2015. The current usage metrics is available 48-96 hours after online publication and is updated daily on week days.
Initial download of the metrics may take a while.