Fig. 16
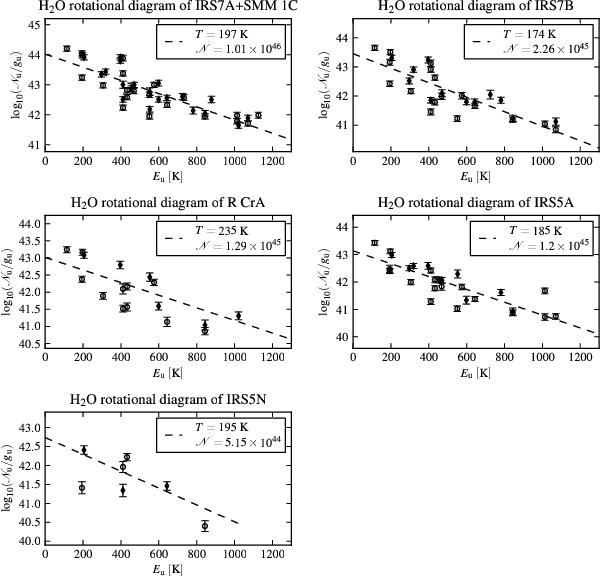
H2O
rotational diagrams of the point sources in the deconvolved PACS data. Ortho lines
are marked with open circles and para lines with filled diamonds.
 is the total number of H2O molecules in each source given the rotational
fit.
is the total number of H2O molecules in each source given the rotational
fit.
Current usage metrics show cumulative count of Article Views (full-text article views including HTML views, PDF and ePub downloads, according to the available data) and Abstracts Views on Vision4Press platform.
Data correspond to usage on the plateform after 2015. The current usage metrics is available 48-96 hours after online publication and is updated daily on week days.
Initial download of the metrics may take a while.