Fig. 15
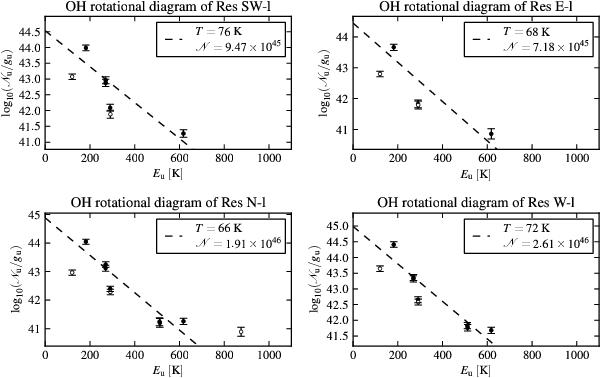
OH rotational diagrams for the residual emission of the extended regions Res
SW-l, Res N-l, Res E-l, and Res W-l. The data points plotted as open circles were
not included in the fit because of optical thickness, blends, or leakage.
 is the total number of OH molecules in each source given the rotational fit.
Current usage metrics show cumulative count of Article Views (full-text article views including HTML views, PDF and ePub downloads, according to the available data) and Abstracts Views on Vision4Press platform.
Data correspond to usage on the plateform after 2015. The current usage metrics is available 48-96 hours after online publication and is updated daily on week days.
Initial download of the metrics may take a while.