Fig. 10
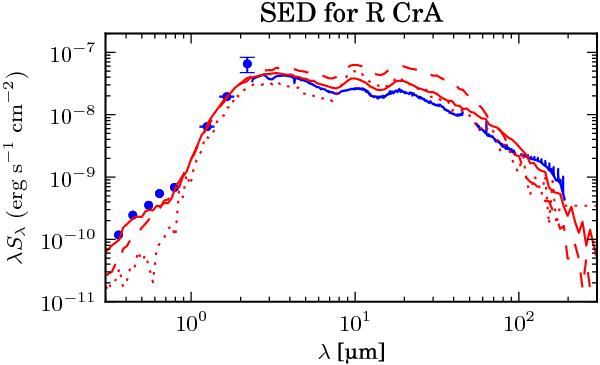
The R CrA SED (blue) with optical (SAAO) and 2MASS data points, and ISO SWS and Herschel/PACS spectra. We note that this SED has a different x-axis than the SEDs in Fig. 8. Overplotted are the best, fifth best, and tenth best fits from the Robitaille model (red solid, dashed, and dotted). The best fit corresponds to Robitaille model ID 3011150, with a disc observed at an inclination of ~81°, an AV = 3.27, the distance 130 pc, and apertures similar to those of the instruments used for the actual observations. The sawtooth pattern at long wavelengths is present because the model is not very accurate at these wavelengths. The ten best fits all correspond to sources with luminosities of at least 480 L⊙ and high inclinations (>80°). For the PACS fit, the continuum flux densities at 70 μm, 100 μm, and 160 μm have been used.
Current usage metrics show cumulative count of Article Views (full-text article views including HTML views, PDF and ePub downloads, according to the available data) and Abstracts Views on Vision4Press platform.
Data correspond to usage on the plateform after 2015. The current usage metrics is available 48-96 hours after online publication and is updated daily on week days.
Initial download of the metrics may take a while.