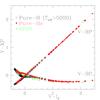
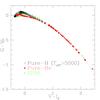
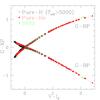
Fig. 7
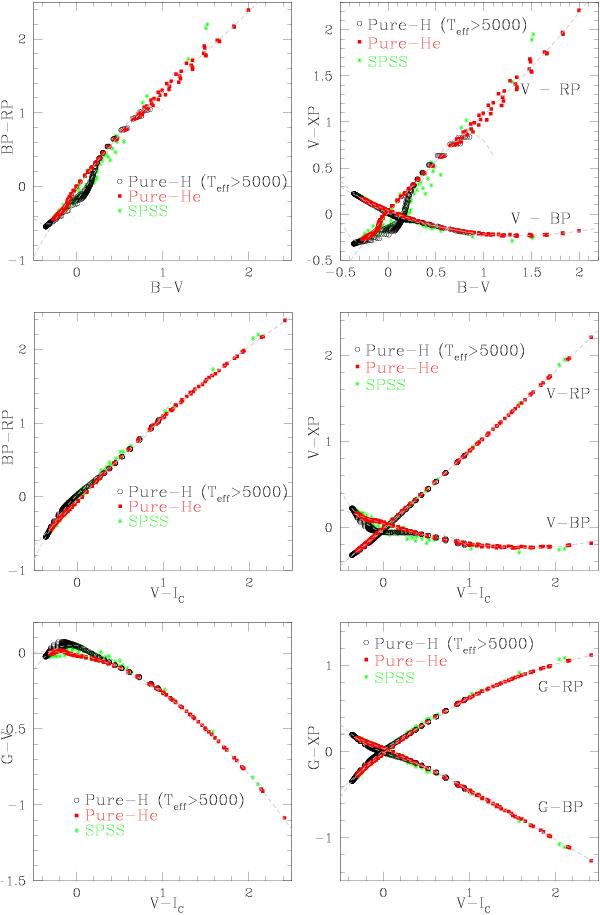
Several colour–colour diagrams obtained using Gaia and Johnson-Cousins passbands for the “normal” regime of pure-H (Teff > 5000 K; black open circles) and for pure-He (red squares) WDs. Green star symbols correspond to real WDs selected from Pancino et al. (2012). Grey dashed curves are the fitted polynomials from Table 6.
Current usage metrics show cumulative count of Article Views (full-text article views including HTML views, PDF and ePub downloads, according to the available data) and Abstracts Views on Vision4Press platform.
Data correspond to usage on the plateform after 2015. The current usage metrics is available 48-96 hours after online publication and is updated daily on week days.
Initial download of the metrics may take a while.