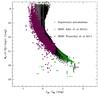
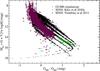
Fig. 17

Hertzsprung–Russell diagram built using only Gaia observable quantities (G, GBP, GRP, and parallaxes) for single WDs with G ≤ 20 obtained from Napiwotzki (2009), top, and GUMS, bottom. The Hertzsprung–Russell GUMS diagram considers discrete values for log g, which is reflected as quantised trends in this plot. SDSS WD samples extracted from Tremblay et al. (2011) and Kilic et al. (2010a) are overplotted with error bars as expected from Gaia observations. Table 2 shows that almost all SDSS WD plotted here have relative error of parallaxes better than 10%.
Current usage metrics show cumulative count of Article Views (full-text article views including HTML views, PDF and ePub downloads, according to the available data) and Abstracts Views on Vision4Press platform.
Data correspond to usage on the plateform after 2015. The current usage metrics is available 48-96 hours after online publication and is updated daily on week days.
Initial download of the metrics may take a while.