Free Access
Fig. 4
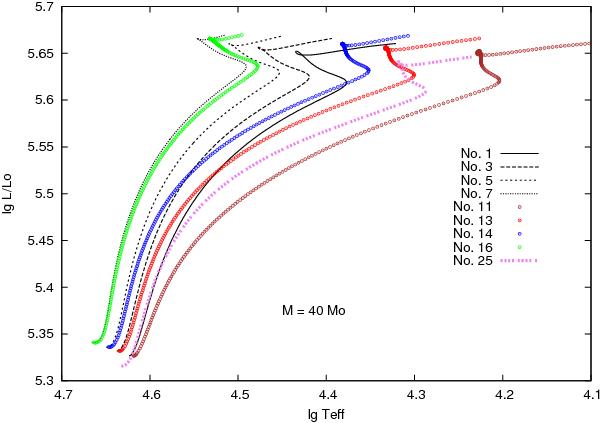
H-R diagram for OPAL and K-OPAL models of M = 40 M⊙ calculated with different initial chemical compositions. The evolutionary tracks were numbered according to the opacity data listed in Table 1. (A color version of the figure is available online.)
Current usage metrics show cumulative count of Article Views (full-text article views including HTML views, PDF and ePub downloads, according to the available data) and Abstracts Views on Vision4Press platform.
Data correspond to usage on the plateform after 2015. The current usage metrics is available 48-96 hours after online publication and is updated daily on week days.
Initial download of the metrics may take a while.