Fig. 1
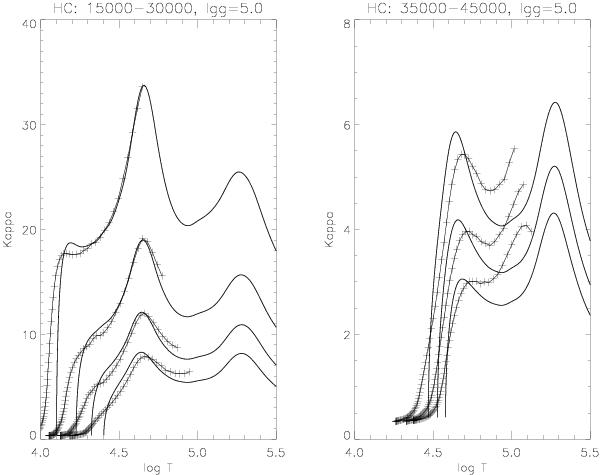
Rosseland-mean opacity κR [ cm2 g-1 ] vs. lgT taken from the Castelli & Kurucz (2003) atmosphere models of lgg = 5.0, Teff = 15 000, 20 000, 25 000, 30 000 K (left panel) and Teff = 35 000,40 000,45 000 K (right panel) in comparison with envelope models calculated with the OPAL data. The atmosphere models corresponding to the microturbulent velocity ξ = 0 (taken from the Castelli website) were plotted as lines with pluses. Both the CK and OPAL models were calculated for X = 0.7347 and Z = 0.0169.
Current usage metrics show cumulative count of Article Views (full-text article views including HTML views, PDF and ePub downloads, according to the available data) and Abstracts Views on Vision4Press platform.
Data correspond to usage on the plateform after 2015. The current usage metrics is available 48-96 hours after online publication and is updated daily on week days.
Initial download of the metrics may take a while.