Fig. 1
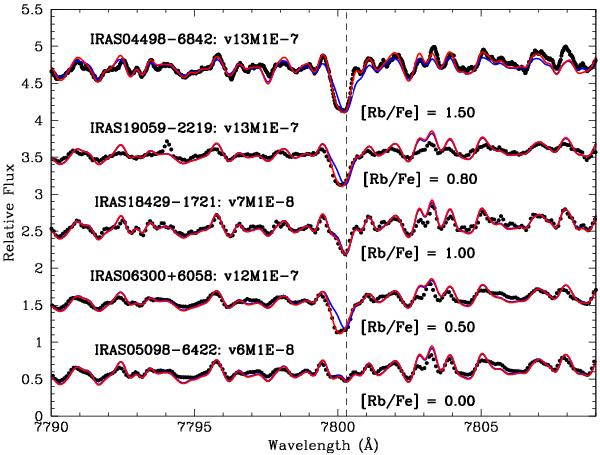
Rb abundances derived in the sample stars using dynamical models. The location of the Rb I stellar line is indicated by a dashed line. Dynamical models providing the best fits to the observations (black dots) are indicated by a red line. Hydrostatic models are also shown for comparison (blue lines). The expansion velocity and the mass-loss rate adopted in the models also are indicated for each star.
Current usage metrics show cumulative count of Article Views (full-text article views including HTML views, PDF and ePub downloads, according to the available data) and Abstracts Views on Vision4Press platform.
Data correspond to usage on the plateform after 2015. The current usage metrics is available 48-96 hours after online publication and is updated daily on week days.
Initial download of the metrics may take a while.