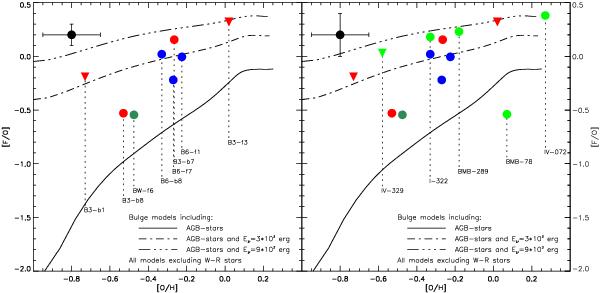
Fig. 6
Our fluorine abundances compared with the predictions of our bulge models including AGB stars, excluding and including the ν-process with two different energies, and excluding W-R stars. The abundances have been transformed to the scale of the models with log ϵ(F)⊙ = 4.56 and log ϵ(O)⊙ = 8.93 (Anders & Grevesse 1989). The stars are color-coded as the corresponding fields in Fig. 1 with the BW-stars of Cunha et al. (2008) added in the right panel in light green. Conservative estimates of the uncertainties are marked in the upper left-hand corners. We note that the star BMB-78, still after the re-analysis, falls below the rest of the trend; see Sect. 5 for possible explanations.
Current usage metrics show cumulative count of Article Views (full-text article views including HTML views, PDF and ePub downloads, according to the available data) and Abstracts Views on Vision4Press platform.
Data correspond to usage on the plateform after 2015. The current usage metrics is available 48-96 hours after online publication and is updated daily on week days.
Initial download of the metrics may take a while.