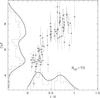
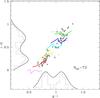
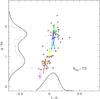
Fig. 1
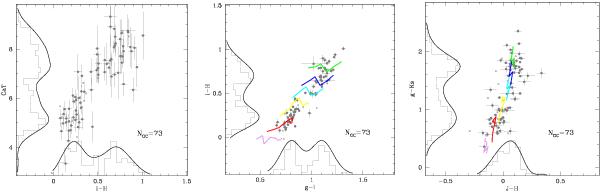
Color-CaT and a selection of color–color diagrams for the HS sample (sel#1, full gray circles). Open circles mark GC candidates rejected by the adopted selection criteria. SPoT SSP models for [Fe/H] = −2.3 (pink), −1.3 (red), −0.7 (yellow), −0.3 (cyan), 0.0 (blue) and + 0.3 (green) dex are also shown. The age range is 2 ≤ t(Gyr) ≤ 14, at fixed metallicity younger ages have bluer color. Histograms, and nonparametric density estimates for histograms are also shown with arbitrary scale. (This figure is available in color in electronic form.)
Current usage metrics show cumulative count of Article Views (full-text article views including HTML views, PDF and ePub downloads, according to the available data) and Abstracts Views on Vision4Press platform.
Data correspond to usage on the plateform after 2015. The current usage metrics is available 48-96 hours after online publication and is updated daily on week days.
Initial download of the metrics may take a while.