Fig. 1
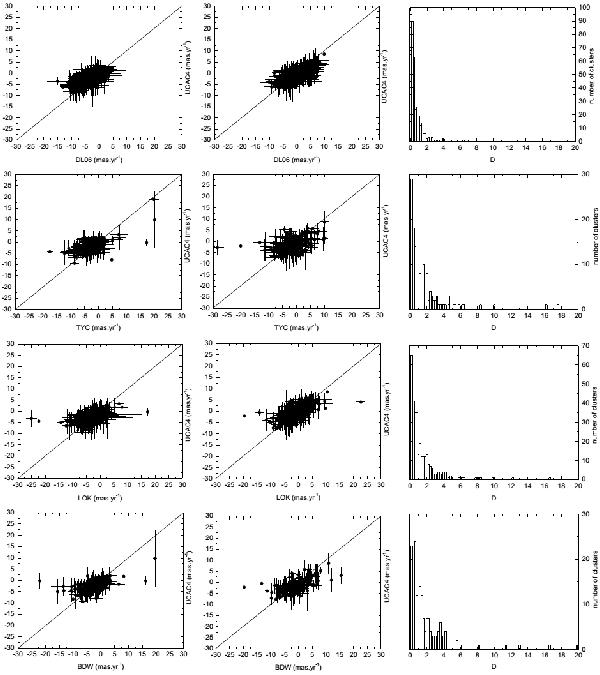
Comparison of our results for mean proper motions with those provided in the literature post-Hipparcos catalog. The lines at 45° are the loci of equal proper motion. The right panels present the distribution of the proper motion differences for each comparison, taking into account the right ascension and declination components weighted by the formal errors (quantity D, see text). The mean and the standard deviation values are given in Table 1. The distribution of quantity D indicates that no statistical distinction exist between the compared proper motion distributions within the estimated errors. The literature codes are given in the Table 1, and details are given in the text.
Current usage metrics show cumulative count of Article Views (full-text article views including HTML views, PDF and ePub downloads, according to the available data) and Abstracts Views on Vision4Press platform.
Data correspond to usage on the plateform after 2015. The current usage metrics is available 48-96 hours after online publication and is updated daily on week days.
Initial download of the metrics may take a while.