| Issue |
A&A
Volume 564, April 2014
|
|
|---|---|---|
| Article Number | A1 | |
| Number of page(s) | 13 | |
| Section | Stellar structure and evolution | |
| DOI | https://doi.org/10.1051/0004-6361/201323194 | |
| Published online | 26 March 2014 | |
Roche-lobe filling factor of mass-transferring red giants: the PIONIER view⋆
1
ESO, Alonso de Córdova 3107, Casilla 19001,
Santiago,
Chile
e-mail:
hboffin@eso.org
2
Instituut voor Sterrenkunde, KU Leuven, Celestijnenlaan 200D,
3001
Leuven,
Belgium
3
ESO, Karl-Schwarzschild-Strasse 2, 85748
Garching bei München,
Germany
4
Institut d’Astronomie et d’Astrophysique, Université Libre de
Bruxelles, Campus Plaine CP 226, Bd
du Triomphe, 1050
Bruxelles,
Belgium
5
Max Planck Institute for Extraterrestrial Physics,
Giessenbachstrasse,
85741
Garching,
Germany
6
UJF-Grenoble 1/CNRS-INSU, Institut de Planétologie et
d’Astrophysique de Grenoble (IPAG) UMR 5274, 38041
Grenoble,
France
7
Copernicus Astronomical Center, Bartycka 18,
00-716
Warsaw,
Poland
Received:
4
December
2013
Accepted:
31
January
2014
Using the PIONIER visitor instrument that combines the light of the four Auxiliary Telescopes of ESO’s Very Large Telescope Interferometer, we precisely measure the diameters of several symbiotic and related stars: HD 352, HD 190658, V1261 Ori, ER Del, FG Ser, and AG Peg. These diameters – in the range of 0.6−2.3 milli-arcsec – are used to assess the filling factor of the Roche lobe of the mass-losing giants and provide indications on the nature of the ongoing mass transfer. We also provide the first spectroscopic orbit of ER Del, based on CORAVEL and HERMES/Mercator observations. The system is found to have an eccentric orbit with a period of 5.7 years. In the case of the symbiotic star FG Ser, we find that the diameter changes by 13% over the course of 41 days, while the observations of HD 352 are indicative of an elongation. Both these stars are found to have a Roche filling factor close to 1, as is most likely the case for HD 190658 as well, while the three other stars have factors below 0.5–0.6. Our observations reveal the power of interferometry for the study of interacting binary stars; the main limitation in our conclusions is the poorly known distances of the objects.
Key words: binaries: spectroscopic / binaries: symbiotic / techniques: interferometric / accretion, accretion disks
Table 7 and Figs. 9–18 are available in electronic form at http://www.aanda.org
© ESO, 2014
1. Introduction
Symbiotic stars show in their spectra the blended characteristics of a cool star (generally a K or M giant), a hot star (a white dwarf in most cases), as well as emission lines coming from a high-excitation nebula. With orbital periods in the range of a few hundred to a thousand days, they are thought to be among the interacting binary stars with the longest periods, in which the mass-losing red giant is transferring mass to its hot companion (Mikołajewska 2007). Their study has important implications for a wide range of objects, such as Type Ia supernovae, barium stars, the shaping of planetary nebulae, and compact binaries such as cataclysmic variables (Podsiadlowski & Mohamed 2007).
Measured diameter of our target stars.
A critical question related to symbiotic stars is whether mass transfer is taking place through a stellar wind or Roche lobe overflow (Mikołajewska 2012), i.e. what is the Roche-lobe-filling factor of the giant in those systems. There is a well-known apparent contradiction between the radius derived from the rotational velocities (when assuming synchronisation), which in most cases indicates that the giant fills about only half its Roche lobe, and the fact that many of the symbiotic stars show the clear signature of ellipsoidal variations in their light curve, indicative of a much larger filling factor. This paper aims at addressing this question in the most direct way.
Blind et al. (2011) have shown the power of interferometry when studying the symbiotic star SS Lep. Using PIONIER/VLTI data, they fully constrained the orbit of the system and determined the mass of each component. They also revised the M giant’s size to lower values than previously found, proving that the system was not currently undergoing a strict1 Roche lobe overflow, the giant’s filling factor being about 86%. Significant mass transfer did happen in this system, however, because the mass of the most evolved star is less than half the mass of its companion.
It is not always possible to obtain as many data as in the case of SS Lep (e.g. in most symbiotic systems, the hot star would not have a signature in the infrared) and thus to constrain the system as much. However, there are several systems for which it is possible to determine, with great accuracy, the diameter of the mass-losing giant. This, combined with previous data, could already answer the critical question raised above and, more particularly, constrain the Roche lobe filling factor. Using the PIONIER/VLTI interferometric instrument, we have measured the diameter of several symbiotic and related stars. The observations are presented in Sect. 2, and we discuss each system in turn in Sect. 3.
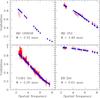 |
Fig. 1 PIONIER squared visibilities for the stars HD 190658, HD 352, V1261 Ori, and ER Del as a function of the spatial frequency in 1/rad (×107). The data points are shown in red with error bars, while the uniform disc model that provides the best fit is indicated with blue solid dots. |
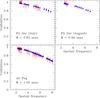 |
Fig. 2 Same as Fig. 1 for the stars FG Ser (on 3 July and on 13 August 2012) and AG Peg. |
2. Observations, data reduction, and results
We observed six symbiotic or related stars with the four 1.8-m Auxiliary Telescopes of ESO’s Very Large Telescope Interferometer, using the PIONIER visitor instrument (Berger et al. 2010; Le Bouquin et al. 2011) in the H-band on the nights of 3 March, 3 July and 13 August 2012 (see Table 1). For all targets, except V1262 Ori, we used the prism in low resolution (SMALL) which provides a spectral resolution R ~ 15, the fringes being sampled over three spectral channels. For one of our brightest objects in H, V1262 Ori, we used the high-resolution (LARGE) mode, which provides a spectral resolution R ~ 40, the fringes being sampled over seven spectral channels. The large VLTI configuration A1-G1-I1-K0 was used, leading to baselines of 47 (H1-I1 and K0-I1), 80 (A1-G1), 91 (G1-K0), 107 (A1-I1), and 129 metres (A1-K0). The list of calibrators used can be found in Table 7 (online only).
Data reduction was done in the usual way with the pndrs package presented by Le Bouquin et al. (2011) and the LITpro software2 (Tallon-Bosc et al. 2008) was used to fit a uniform disc to the visibilities and closure phases. Our results are shown in Figs. 1 and 2, as well as in Table 1. As can be seen in this table, where the last column indicates the resulting reduced χ2, for all stars but HD 352, the assumption of a uniform disc leads to a very good fit. The stars that are studied in this paper are all known to be single-lined spectroscopic binaries and it is thus safe to assume that there should be no contribution from the companion to the total flux. This is even more true in the H-band, as the companion is always a hot star. Our observations should thus mostly reveal only the primary giant, hence our attempt to only fit a uniform disc to represent it. This conclusion is further strengthened by the fact that we did not detect any significant non-zero closure phases. There is a possible caveat, however, as revealed by the observations of SS Lep (Blind et al. 2011). The fact that the mass loss in symbiotic stars is much higher than in normal giants and leads to the observed activity may result in either detectable circumstellar matter or a circumbinary disc. We have thus to make sure that there is no additional background present in our data. We therefore show in online Figs. 12 to 18 the χ2 maps corresponding to models where a background is added to the uniform disc. These maps clearly show that the assumption of no background leads to the minimum χ2, i.e. the best fit. In addition, we have verified that for all our targets except for HD 352 (see below), using an elongated disc or Gaussian does not provide a better fit to our data. The errors, σ, quoted in Table 1 have been conservatively calculated, based on the relation:
 where Φ is the diameter in milli-arcseconds (mas).
The first term takes into account the fact that the Nsp spectral
channels of PIONIER are almost perfectly correlated, while LITpro assumes that points are
independent, and the second term (a relative error of 1%) arises from the fact that the
wavelength calibration is only precise at the 1% level, which leads to a similar uncertainty
on the diameter. As mentioned above, for all our targets, Nsp = 3, except
for V1262 Ori, where Nsp = 7.
where Φ is the diameter in milli-arcseconds (mas).
The first term takes into account the fact that the Nsp spectral
channels of PIONIER are almost perfectly correlated, while LITpro assumes that points are
independent, and the second term (a relative error of 1%) arises from the fact that the
wavelength calibration is only precise at the 1% level, which leads to a similar uncertainty
on the diameter. As mentioned above, for all our targets, Nsp = 3, except
for V1262 Ori, where Nsp = 7.
3. Discussion
In this section, we look at each of our target stars in turn, starting from those for which the most data are available. In our discussion, except for FG Ser, we will neglect any effect of extinction. For all our targets, we computed the visual extinction, AV, given by version 2.0.5 of the EXTINCT subroutine (Hakkila et al. 1997), and the resulting extinction in the K-band, using the usual conversion AK = 0.114 AV. Except for FG Ser and HD 190658, we found AK to be only of the order of 0.01 mag. For HD 190658, we get AK = 0.06, which can also be neglected, while for FG Ser, we derive AK = 0.185 mag and we will take this into account in our discussion.
Fitting our visibilities, we obtain uniform disc diameters. In principle, we should convert these to limb-darkened diameters, as these are generally used in computing luminosities. However, the conversion factor from a uniform disc to a limb-darkened disc is in the range 1.02−1.04 (see, e.g. Blind et al. 2011, and references therein). The effect of neglecting extinction and of using a uniform disc instead of a limb-darkened disc are much smaller than the errors resulting from the distance, which are around 15% or much larger, and there is no need to introduce additional complications and unknowns.
3.1. HD 190658
The object HD 190658 (V1472 Aql, HR 7680, HIP 98954) is a M2.5 III star in a binary system with a relatively short orbital period (P = 198.716 days; Lucke & Mayor 1982) – the second smallest in the sample of Famaey et al. (2009). It is in a sense a sister system to the symbiotic star SS Lep, with a similar period, and therefore deserves further study. It should be noted, however, that unlike SS Lep, this system is not an Algol, nor a double-lined spectroscopic binary, and does not show any circumstellar or circumbinary material. In this sense, it is much easier to model.
Hipparcos measurements show photometric variations with about half the orbital period (P = 100.37 d) and 0.16 mag amplitude, which led Samus (1997) to conclude that the object is an eclipsing or ellipsoidal variable star. The fact that this period is almost exactly half the orbital period further strengthens this conclusion.
We can use the BCK vs. (J − K) relation of Kerschbaum et al. (2010) to derive the distance-independent effective temperature of the star, Teff = 3263 ± 35 K, from our measured angular diameter. Coupling the parallax ϖ = 7.92 ± 1.07 mas (van Leeuwen 2007) with our measured diameter of 2.33 mas, we derive a linear radius of 31.6 ± 4.3 R⊙.
As the system presents detectable ellipsoidal variations, its inclination can be assumed to be rather high, typically between 50 degrees and 90 degrees. If we take the latter value and assume3 that the giant has a mass between 0.8 M⊙ and 3 M⊙, we can then estimate companion masses between 0.40 M⊙ and 0.88 M⊙, and Roche lobe radii between 73 R⊙ and 110 R⊙, respectively, using the measured spectroscopic mass function f(m) = 0.0449M⊙ derived by Lucke & Mayor (1982). Thus, the filling factor of the giant is thought to be between 0.29 and 0.43. Using i = 50° instead of 90° would only increase the filling factor by 3%.
Thus, strangely enough, if we were to use the parallax from van Leeuwen (2007), we would have to conclude that this star is far from filling its Roche lobe and the origin of the ellipsoidal variations would be quite puzzling. The absolute magnitude we deduce from using this parallax (Mbol = −0.25 or L = 100 L⊙) also seems very low when compared to evolutionary tracks, and would imply that the star has a mass well below 1 M⊙, which as mentioned above is unlikely (see Fig. 8).
D. Pourbaix (priv. comm.) has reprocessed the original Hipparcos Intermediate
Astrometric Data (IAD; van Leeuwen & Evans
1998) and found that taking into account the effect of orbital motion would lead
to a parallax of 2.6 ± 0.9
mas, while if one assumes the photocentre to vary with half the orbital period (i.e. the
ellipsoidal variation one) one gets a parallax of 2.12 mas. We are thus led to
conservatively conclude that the true parallax is given by ϖ = 2.4 ± 1.0 mas. The star
is thus three times farther away from us than previously thought. In this case, we derive
a linear radius of 104 ± 56 R⊙. This means that the star
is filling between 43% and 100% of its Roche lobe. Using this parallax, we find a
bolometric magnitude Mbol = −2.6 ± 1.0 (or a luminosity
 ), much more in
line with stellar evolution models.
), much more in
line with stellar evolution models.
3.2. HD 352
According to SIMBAD, HD 352 (HR 14, AP Psc, 5 Cet, HIP 664) is an eclipsing binary of β Lyr type, i.e. a semi-detached system. Its spectral type is indicated as K2–4 III.
Lines et al. (1984) found the star to present ellipsoidal variations with amplitude ~0.2 mag, which was also found by Hipparcos. Beavers & Salzer (1985) provided a revised orbit with an orbital period of 94.439 days and Eaton & Barden (1986) reported the rotational velocity to be vsini = 22 ± 3 km s-1. The same authors later claimed (Eaton & Barden 1988) that the main-sequence companion is accreting mass from a Roche-lobe overflowing giant at a rate of 5 × 10⁻⁷M⊙ yr-1. More recently, Komonjinda et al. (2011) recomputed the orbital solution of this system and found a period of 96.4371 days.
The revised Hipparcos parallax (van Leeuwen 2007) is 3.58 ± 0.48 mas, which leads to a linear radius of 44.7 ± 6.0 R⊙, given our diameter measurement of 1.49 mas. Using the same procedure as for HD 190658, we derive a bolometric magnitude of −1.78 (or a luminosity of 410 L⊙) and an effective temperature of 4000 ± 100 K, which corresponds to a K4–5 III star.
The measured vsini is compatible with the star being in synchronous rotation provided we assume the inclination i = 67 ± 23°. In this case, we can use the observed spectroscopic mass function, f(m) = 0.13589 M⊙, to relate the mass of the hot star, M1, to that of the giant, M2. For M2 < 1.5 M⊙ (as required by the observed stellar parameters of the giant), we have M1 < 1 M⊙, and the Roche lobe filling factor is always larger than 90% (±10%). If the mass of the giant is below 1.12 M⊙, it is filling completely its Roche lobe. This is in agreement with Hall (1990), even though this author derived smaller values for the masses and radius. As for HD 190658, the Roche lobe filling factor is not very sensitive to the inclination that we use, i.e. it only varies by a few percentage points. We note that the spectroscopic mass function allows the secondary to be more massive than the giant primary (that is, the system is an Algol) only if the inclination is smaller than 60° (and the primary is not very massive), which is not very likely as we see ellipsoidal variations.
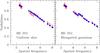 |
Fig. 3 Squared visibilities for HD 352 as observed with PIONIER (red points with error bars), compared to a model with a uniform disc (blue dots; left panel) and an elongated Gaussian (right panel). The spatial frequency is given in 1/rad (×107). |
Given this Roche lobe filling factor and the presence of ellipsoidal variations, we could imagine that the star is tidally distorted. Our visibilities seem to indicate this, as the model shown in Fig. 1 is not a very good fit to the data. Using an elongated disc or an elongated Gaussian instead of a uniform disc, we can obtain a much better fit to the visibilities (see Figs. 3 and 4). While an elongated disc can be seen as a rough approximation of a tidally distorted star, an elongated Gaussian could indicate that it is the wind that is filling the Roche lobe, as in the second case we may expect some density gradient. At this stage, we cannot distinguish between an elongated disc or an elongated Gaussian, as the χ2 are similar, but there is a clear indication of distortion. The resulting reduced χ2 drops from 2.48 for a uniform disc to 1.25 for an elongated Gaussian with an elongation ratio of 1.16 (the star is 1.38 × 1.6 mas wide). We defer to a later paper a detailed comparison with a modelling code, and after we have obtained additional data for this system to show how the angular diameter changes with time. However, we should mention that using the ephemeris of Komonjinda et al. (2011), our observations were done at a spectroscopic phase of 0.46, i.e. when the star is moving away from us and is almost at its highest velocity. This would correspond to a photometric phase of 0.21 and thus close to where we expect the highest deformation of the star. The deformation we measure is oriented between 125 and 150 degrees, depending on the solution we use. We note that the data are not good enough to completely constrain the shape of the star; it is also possible to obtain a similarly good fit when using an elongated disc with a major axis of 1.71 mas and an elongation ratio of 1.19, or when using a geometrical model that contains both an elongated disc and a point source, which would contribute about 2.7% to the flux in the H-band. The errors on the parameters are too large, however, in this last case to provide useful constraints. We note that the closure phases are all smaller than 2 degrees, and compatible with zero given the error bars (see Fig. 11 online). Clearly, more data are required on this system, in particular with longer baselines to reach the second lobe, as this would make it easier to confirm the elongated disc model.
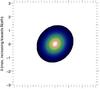 |
Fig. 4 Model image of the elongated Gaussian that best fits the PIONIER visibilities for HD 352: the elongation ratio is 1.156 ± 0.026, the star is 1.38 × 1.6 mas wide, with the major axis position angle at 138 ± 4 degrees. |
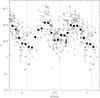 |
Fig. 5 The ASAS V lightcurve of V1261 Ori, phased with the orbital period of 638.24 d. |
3.3. V1261 Ori
The source V1261 Ori (HD 35155, HIP 25092) is an extrinsic S star that shows evidence of
mass-transfer activity and is therefore also classified as a symbiotic star (Ake et al. 1991; Van Eck
& Jorissen 2002). As an extrinsic S star, it is the outcome of a previous
mass transfer which polluted it in carbon and s-process elements. The hot star should
thus, according to this scenario, be a white dwarf. Van Leeuwen (2007) gives a parallax ϖ = 3.47 ± 0.84 mas, putting it 288 pc away.
Pourbaix & Jorissen (2000), however,
obtained the astrometric orbital elements for that star by reprocessing the Hipparcos
IAD using the knowledge of the spectroscopic orbital elements. A satisfactory
solution (in terms of reduced χ2) emerges, with a revised parallax
 (i.e. a distance of 510
 pc), and an orbital inclination of 100° ± 26°. This value for the orbital
inclination possibly allows for eclipses, and one such event has been reported by Jorissen et al. (1992a) in the Strömgren
y filter. A
weakening of the companion UV continuum, at the phase corresponding to the superior
conjunction, has also been reported by Ake et al.
(1991) from a series of IUE spectra. Obviously, the eclipsed light cannot be that
of the white dwarf, which is too faint, but might come from a hot spot, for example. That
spot is obviously intermittent, since the eclipsing behaviour is not seen in more recent
years, as shown by the ASAS lightcurve (Fig. 5, where
it is phased with the orbital period of 638.24 d; Pojmanski 1997). As already shown by Gromadzki, Mikolajewska & Soszynski
(2013), there is a clear modulation with the
orbital motion, in the form of a double sine-wave, which suggests an ellipsoidal
variation. The large filled squares in Fig. 5
correspond to the average of the data points over a phase range of ± 0.05. The noise around this average curve
is caused by semi-regular variations with a timescale of the order of 56 d and a
semi-amplitude of 0.1 mag. The dashed and dotted lines in Fig. 5 correspond to the superior (companion behind the S star) and inferior
conjunctions, respectively, based on updated orbital elements, thanks to two recent
HERMES/Mercator radial-velocity measurements obtained on HJD
2 455 164.69083, with Vr = 78.826 ± 0.006 km s-1, and HJD 2 455 235.446 with
Vr = 85.265 ± 0.008 km s-1; these velocities are on the
IAU system to ensure consistency with the older CORAVEL velocities (Jorissen & Mayor 1992b) and allowed us to accurately constrain
the orbital period, as shown in Table 2 and Fig.
6. The eccentricity is also accurately determined
thanks to these two recent velocity measurements, and happens to be small, even if
significantly different from zero. The combination of a non-zero eccentricity with
ellipsoidal variations is a bit surprising, since ellipsoidal variations imply a filling
factor close to unity, which rapidly (i.e. in a few 107 yr) circularises the orbit
and also synchronises the giant’s spin with the orbital motion.
pc), and an orbital inclination of 100° ± 26°. This value for the orbital
inclination possibly allows for eclipses, and one such event has been reported by Jorissen et al. (1992a) in the Strömgren
y filter. A
weakening of the companion UV continuum, at the phase corresponding to the superior
conjunction, has also been reported by Ake et al.
(1991) from a series of IUE spectra. Obviously, the eclipsed light cannot be that
of the white dwarf, which is too faint, but might come from a hot spot, for example. That
spot is obviously intermittent, since the eclipsing behaviour is not seen in more recent
years, as shown by the ASAS lightcurve (Fig. 5, where
it is phased with the orbital period of 638.24 d; Pojmanski 1997). As already shown by Gromadzki, Mikolajewska & Soszynski
(2013), there is a clear modulation with the
orbital motion, in the form of a double sine-wave, which suggests an ellipsoidal
variation. The large filled squares in Fig. 5
correspond to the average of the data points over a phase range of ± 0.05. The noise around this average curve
is caused by semi-regular variations with a timescale of the order of 56 d and a
semi-amplitude of 0.1 mag. The dashed and dotted lines in Fig. 5 correspond to the superior (companion behind the S star) and inferior
conjunctions, respectively, based on updated orbital elements, thanks to two recent
HERMES/Mercator radial-velocity measurements obtained on HJD
2 455 164.69083, with Vr = 78.826 ± 0.006 km s-1, and HJD 2 455 235.446 with
Vr = 85.265 ± 0.008 km s-1; these velocities are on the
IAU system to ensure consistency with the older CORAVEL velocities (Jorissen & Mayor 1992b) and allowed us to accurately constrain
the orbital period, as shown in Table 2 and Fig.
6. The eccentricity is also accurately determined
thanks to these two recent velocity measurements, and happens to be small, even if
significantly different from zero. The combination of a non-zero eccentricity with
ellipsoidal variations is a bit surprising, since ellipsoidal variations imply a filling
factor close to unity, which rapidly (i.e. in a few 107 yr) circularises the orbit
and also synchronises the giant’s spin with the orbital motion.
Revised orbital elements of V1261 Ori based on two new HERMES/Mercator measurements (see text).
To add to the puzzle, our radius measurement does not lead to a filling factor close to
unity, as we now discuss. The semi-major axis of the photocentric orbit around the centre
of mass of the system (this orbit is equivalent to the orbit of the giant around the
centre of mass if the white dwarf companion contributes no light to the system) is found
to be 1.84 ± 0.9 mas (Pourbaix & Jorissen 2000). Since Jorissen et al. (1992a) estimate the mass ratio to be
M1/M2 = 3
(based on the ratio of the velocity-curve amplitudes, as lines from the hot companion are
visible in the IUE spectrum; Ake et al. 1991), the
relative orbit must have a semi-major axis of 4 × 1.84 = 7.36 mas, with a fractional Roche-lobe size of 0.476 around
the giant, or 3.5 ± 1.7 mas,
to be compared with the measured radius of 1.12 mas (Table 1). The red giant in the V1261
Ori system thus lies well inside its Roche lobe, with a fractional Roche radius of
0.32 ± 0.16, independent of
any assumption on the distance. The interaction in this system is thus most likely due to
wind mass transfer. The ellipsoidal variations reported by Gromadzki et al. (2013, and
Fig. 5) are thus puzzling. Moreover, ellipsoidal
variations are generally concomitant with synchronisation between rotation and orbital
revolution. From the measured diameter of 2.25 mas (Table 1) and the parallax of Pourbaix
& Jorissen (2000), a linear radius of  R⊙ is derived,
implying a rotation velocity of 5.6−16.8 km s-1 if synchronised with the orbital motion. The width of
the HERMES cross-correlation function (CCF; 4.2 km s-1) is typical of M giants Famaey et al. (2009). For this system seen almost
edge-on, the measured CCF width is thus not compatible with the giant being synchronised
with the orbital motion. The interpretation of the orbital modulation of the photometric
variations as being due to ellipsoidal variations, despite seeming likely from the shape
of the light variations, is supported neither by the small filling factor, nor by the
absence of synchronisation. It thus remains an unresolved puzzle for this system in
particular. One possibility could be tidally-enhanced pulsations, although, again, the
relatively low Roche-lobe filling would argue against this.
R⊙ is derived,
implying a rotation velocity of 5.6−16.8 km s-1 if synchronised with the orbital motion. The width of
the HERMES cross-correlation function (CCF; 4.2 km s-1) is typical of M giants Famaey et al. (2009). For this system seen almost
edge-on, the measured CCF width is thus not compatible with the giant being synchronised
with the orbital motion. The interpretation of the orbital modulation of the photometric
variations as being due to ellipsoidal variations, despite seeming likely from the shape
of the light variations, is supported neither by the small filling factor, nor by the
absence of synchronisation. It thus remains an unresolved puzzle for this system in
particular. One possibility could be tidally-enhanced pulsations, although, again, the
relatively low Roche-lobe filling would argue against this.
Results of fitting the parameters for AG Peg, for three assumed values of the inclination i, in the range 30−90 degrees.
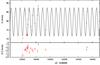 |
Fig. 6 The orbit of V1261 Ori, combining old CORAVEL measurements with recent HERMES/Mercator ones. |
Finally, from our diameter measurement and the estimate of BCK (in agreement with the value quoted by Van Eck et al. 1998), we derive a distance-independent effective temperature of 3470 ± 60 K, leading to Mbol = −3.5 ± 1.2.
3.4. FG Ser
A bona fide symbiotic star, FG Ser (AS 296) is listed as M3e in SIMBAD, while Mürset & Schmid (1999) give it a M5 spectral type. Fekel et al. (2000a) found a revised orbital period of 633.5 ± 2.4 days, and an epoch of conjunction T0 = JD 2,451,031.4 ± 2.9. Zamanov et al. (2007) measure a vsini = 9.8 ± 1 km s-1, and assume a radius R = 139.6 R⊙, from which they deduce that the system is synchronised within the measurement errors. They also assume a mass of the giant of 1.7 M⊙.
We measure an angular diameter for FG Ser that changes with the orbital phase: 0.83 ± 0.03 mas and 0.94 ± 0.05 mas, 41 days later. According to the above mentioned ephemeris, this would correspond to orbital phases very close to the conjunction, and to a difference in phase of only 0.07.
As no distance has been estimated for this object, it is impossible to directly determine
the linear radius and compute the Roche lobe filling factor. We can use an indirect
method, however. Using the distance-independent method and the mean of our angular
diameters we determine the temperature of the red giant to be Teff = 3100 ± 100 K, a value not atypical
for a M5 giant. We can now also assume that the giant is on the first ascent giant branch
and use the relation between the radius and the luminosity of the star, as a function of
its mass; Hurley et al. (2000) provide a fit to
this relation for solar abundances:
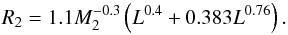 (1)In addition, we can
use the relation
(1)In addition, we can
use the relation  , with θ = Teff/5777
K, as well as the spectroscopic mass function f(m) = 0.0218 ± 0.0025 M⊙
from Zamanov et al. (2007) to relate
M1 to M2 for a given
inclination. This then allows us to compute the final Roche lobe radius and compare it to
the radius of the star. We find that in all cases, the giant is filling its Roche lobe.
For example, for i = 90°, assuming a giant mass of
M2 = 1 M⊙
leads to a companion mass of M1 = 0.34 M⊙,
a giant radius of 158 R⊙, to be compared to a Roche lobe
radius of 162 R⊙. Changing i to 50° leads to M1 = 0.47 M⊙
and a Roche lobe radius of 157 R⊙. Increasing the mass of the giant
further strengthens this conclusion. Assuming a 1 M⊙ giant would
also lead to a synchronised rotational velocity close to 10 km s-1, as observed. It would imply a
distance of the system of 1700 pc (ϖ = 0.59 mas, well beyond the capabilities of
Hipparcos).
, with θ = Teff/5777
K, as well as the spectroscopic mass function f(m) = 0.0218 ± 0.0025 M⊙
from Zamanov et al. (2007) to relate
M1 to M2 for a given
inclination. This then allows us to compute the final Roche lobe radius and compare it to
the radius of the star. We find that in all cases, the giant is filling its Roche lobe.
For example, for i = 90°, assuming a giant mass of
M2 = 1 M⊙
leads to a companion mass of M1 = 0.34 M⊙,
a giant radius of 158 R⊙, to be compared to a Roche lobe
radius of 162 R⊙. Changing i to 50° leads to M1 = 0.47 M⊙
and a Roche lobe radius of 157 R⊙. Increasing the mass of the giant
further strengthens this conclusion. Assuming a 1 M⊙ giant would
also lead to a synchronised rotational velocity close to 10 km s-1, as observed. It would imply a
distance of the system of 1700 pc (ϖ = 0.59 mas, well beyond the capabilities of
Hipparcos).
We conclude that FG Ser is a nominal case of a synchronous giant filling its Roche lobe. The fact that we measure a different angular diameter depending on the orbital phase – even if with a very low significance – confirms the nature of the ellipsoidal variations and the fact that the inclination has to be close enough to an edge-on system. Here again, a detailed modelling of the combined interferometric and photometric data is outside the scope of this paper.
3.5. AG Peg
The symbiotic binary AG Peg (HD 207757, HIP 107848) is unique among the objects in our sample as it is known to have undergone a slow nova eruption when it rose from 9th to 6th magnitude, starting in the mid-1850s. The hot companion is therefore unambiguously a white dwarf, while the red giant primary, which has an M2–M3 spectral type, does not apparently fill its Roche lobe, and loses mass through a low-velocity wind (Kenyon et al. 2001, and references therein). Given the low luminosity of the hot component and very slow outburst development, the white dwarf in AG Peg is probably of low mass, and indeed the radial velocity curve hints at a mass M1 = 0.46 ± 0.10 M⊙ (Mikolajewska, 2010).
Fekel et al. (2000b) provide the orbital elements of this binary system: P = 818.2 ± 1.6 d, e = 0.11 ± 0.039, f(m) = 0.0135 M⊙. Hipparcos found the system to present large photometric variations (A = 0.47 mag) which fit the orbital period, while Rutkowski et al. (2007) claim that the light curve of AG Peg does not show any evidence of a tidally distorted giant. Unfortunately, the Hipparcos astrometry does not provide a significant value for the parallax, which is therefore most likely below 1 mas.
Zamanov et al. (2007) report a vsini = 8.5 ± 1.5 km s-1, a M4 III spectral type, and radius of 71.5 R⊙ for the giant. We find an angular diameter of 1 mas for the giant in this system, which when combined to the J and K magnitudes in the same way as before, leads us to an effective temperature of 3550 ± 120 K, in agreement with the value we derive from the (V − K) index and the relations of Ridgway et al. (1980) or van Belle et al. (2008) and in agreement with the spectral type. We can then again make use of these parameters, and of the spectroscopic orbital elements and a radius-luminosity relation, to derive the parameters of the system, depending on the inclination (see Table 3). Taken at face value, the rotational velocity and the assumption of synchronism, as well as the value of M1 quoted above, would imply an inclination close to 90°, M2 ~ 2−3 M⊙, R2 ~ 99−133 R⊙, and a Roche lobe filling factor f ~ 0.39−0.45. In any case, the filling factor lies – for all reasonable values of the system’s parameters – in the range 0.26−0.54, but the lowest values can be discarded as we need to have a parallax small enough not to be measurable by Hipparcos, while the higher values would imply a white dwarf mass which is too high.
Radial velocities of ER Del.
Orbital elements of ER Del.
3.6. ER Del
This is another example of an S star (S5.5) that exhibits symbiotic-like features (Ake 1979). From its (V − K), we can estimate a temperature around 3500 K using the relation of Ridgway et al. (1980), while the (J − K) can be used to compute BCK = 2.9. Using our angular diameter of 0.61 mas and the above derived BCK, we can also determine the effective temperature and find Teff = 3470 ± 160 K.
Summary table of the parameters of our target stars.
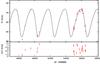 |
Fig. 7 The orbital solution for ER Del. The lower panel provides the O−C residuals. The error bars of the HERMES data points have been artificially increased to 0.3 km s-1. |
Radial-velocity observations were obtained with CORAVEL (COR; Baranne et al. 1979) in 1991−1997, and then from 2009 onwards with the HERMES/Mercator spectrograph (HER; Raskin et al. 2011). They are on the system of IAU radial-velocity standard stars as defined by Udry et al. (1999) and displayed in Table 4. The orbital solution is shown in Table 5 and Fig. 7. It has large residuals (⟨ |O−C| ⟩ = 0.71 km s-1), as is usual for M and S stars (see Fig. 1 in Jorissen et al. 1998; and Fig. 2 in Famaey et al. 2009). Here too, the width of the HERMES CCF is typical of M giants and we cannot measure the rotational velocity of this giant.
By using the same methodology as above, we are led to conclude that the filling factor is between 0.2−0.3, for a wide range of parameters. If we assume synchronisation, the derived radius leads to rotation velocities of 2−3 km s-1, which would indeed be below the detection limit. If we make use of the fact that ER Del is an S star and so assume the typical masses for the components of such a post-mass transfer system, and in particular for the white dwarf, we are led to the conclusion that i > 40°. For i = 50° and M1 = 0.7 M⊙, we find M2 = 2 M⊙, Mbol = −3.3,d = 1750 pc, and ϖ = 0.58 mas. For i = 90° and M1 = 0.7 M⊙, we find M2 = 3.25 M⊙, Mbol = −4,d = 2600 pc, and ϖ = 0.39 mas. In any case, the giant is well within its Roche lobe.
4. Conclusions
Table 6 summarises our results and shows for each target the effective temperature, radius, bolometric magnitude, and Roche lobe filling factor we are able to derive. The last two columns indicate the rotational velocity (if known) and whether the rotation is synchronised with the orbital motion. Our analysis has shown that, as already known, red giants in symbiotic systems are rather normal and obey similar relations between colour, spectral type, temperature, luminosity, and radius – a result which stems, for example, from the distance-independent effective temperature and from the bolometric magnitude we derive. We have demonstrated that in two cases, HD 352 and FG Ser, the star is almost filling or completely filling its Roche lobe, in agreement with these objects presenting ellipsoidal variations. The source HD 352 presents a clear deviation from a spherical shape, with an elongation of 16% or more, while two separate observations of FG Ser clearly indicate different angular diameters, indicative of a tidal deformation. For HD 190658, if we adopt the published parallax, we would find a Roche lobe filling factor well below 0.5, putting some doubt on the reported ellipsoidal variations. However, we have reasons to think that this parallax is in error by a factor of 3, thereby implying that the star is filling between 50% and 100% of its Roche lobe. For ER Del, we provide the first orbit of this system, indicating that it is a rather long-period symbiotic system. ER Del and the two other stars have much smaller Roche lobe filling factors – between 25% and 60% smaller. It is noteworthy that V1261 Ori apparently exhibits ellipsoidal variations despite a filling factor of only 0.3−0.5.
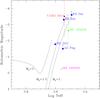 |
Fig. 8 Hertzsprung-Russell diagram showing the positions of our target stars (full dots, in blue), together with Yonsei-Yale (Y2) evolutionary tracks for solar abundance stars with initial masses of 1, 1.5, and 3 M⊙. For FG Ser, ER Del, and AG Peg, we have only lower limits for the bolometric magnitude. The range for V1261 Ori is indicated with the red dashed line. For HD 190658, we indicate in magenta (open square) the value using the published and seemingly incorrect parallax (7.92 mas) and in green (full triangle) the value with our newly derived parallax. |
We also present in Fig. 8 a Hertzsprung-Russell diagram that summarises our results. The values we derived for the effective temperatures and bolometric magnitudes of our target stars are indicated, together with Y2 evolutionary tracks (Yi et al. 2001) for stars with solar abundance and initial masses between 1 M⊙ and 3 M⊙.
For those stars for which Hipparcos provided a useful distance, the rather large error (>15%) is what limits the precision we have on the linear radius of the giant. It would thus be very useful if these distances could be determined with higher precision. It would also be as important to estimate the distances for those objects analysed here but for which no distance is currently known. In this respect, the recent launch of the ESA Gaia satellite offers great prospects; Gaia will allow us to obtain parallaxes for our targets with a precision of a few microarcseconds (Lindegren et al. 2008), while at the same time being able to clearly disentangle the binary motion from the parallactic motion (Pourbaix 2008), and the main source of uncertainty on the Roche-lobe filling factor will be the error arising from the interferometric measurements. While Gaia will be able to perform these measurements for most or all symbiotic stars known, interferometric measurements are currently limited to only a handful of additional systems, those which are bright enough in the H-band and that have reliable orbital elements for further analysis.
Online material
Calibrators used for PIONIER observations.
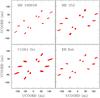 |
Fig. 9 UV-plane coverage of our PIONIER observations for the stars HD 190658, HD 352, V1261 Ori, and ER Del. |
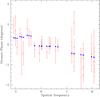 |
Fig. 11 PIONIER closure phases for HD 352 (in degrees) as a function of the spatial frequency in 1/rad (×107). The data points are shown in red with error bars, while the model of an elongated disc with an additional punctual source that provides the best fit is indicated with blue solid dots. Given the error bars, the significance of these data, compared to zero closure phases, is very low, as all but three points do not deviate from zero more than the error bar. |
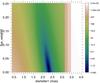 |
Fig. 12 Reduced χ2 maps for HD 190658: shown is the reduced χ2 (logarithmic scale) as a function of the angular diameter (x-axis) and the relative flux level of the background (y-axis) based on our PIONIER data. These maps were computed using LITpro assuming a uniform disc plus background model. It is clear that the minimal reduced χ2 corresponds to the model without any added background. |
There is still the possibility of wind Roche lobe overflow, or that the Roche lobe radius is reduced with respect to the canonical value, in case there is a strong mass loss (see Blind et al. 2011, for more details).
LITpro is available from http://www.jmmc.fr/litpro_page.htm
Acknowledgments
It is a pleasure to thank Dimitri Pourbaix for reprocessing the Hipparcos data of HD 190658. Based on observations made with the ESO Very Large Telescope Interferometer under Prog. ID 089.D-0527(A). PIONIER is funded by the Université Joseph Fourier (UJF, Grenoble) through its Pôles TUNES and SMING and the vice-president of research, the Institut de Planétologie et d’Astrophysique de Grenoble, the “Agence Nationale pour la Recherche” with the programme ANR EXOZODI, and the Institut National des Sciences de l’Univers (INSU) with the programmes “Programme National de Physique Stellaire” and “Programme National de Planétologie”. The integrated optics beam combiner is the result of a collaboration between IPAG and CEA-LETI based on CNES R&T funding. Based on observations made with the Mercator Telescope, operated on the island of La Palma by the Flemish Community, at the Spanish Observatorio del Roque de los Muchachos of the Instituto de Astrofísica de Canarias. Based on observations obtained with the HERMES spectrograph, which is supported by the Fund for Scientific Research of Flanders (FWO), Belgium, the Research Council of KU Leuven, Belgium, the Fonds National de la Recherche Scientifique (FNRS), Belgium, the Royal Observatory of Belgium, the Observatoire de Genève, Switzerland and the Thüringer Landessternwarte Tautenburg, Germany. This research has made use of the Jean-Marie Mariotti Center Aspro2, LITpro and SearchCal service, available at http://www.jmmc.fr/aspro, and of the SIMBAD database, operated at Centre de Données astronomiques de Strasbourg (CDS), France, as well as the Smithsonian/NASA’s Astrophysics Data System (ADS). J.M. is supported by Polish NSC grant DEC-2011/01/B/ST9/06145.
References
- Ake, T. B. 1979, ApJ, 234, 538 [NASA ADS] [CrossRef] [Google Scholar]
- Ake, T. B., III, Johnson, H. R., & Ameen, M. M. 1991, ApJ, 383, 842 [NASA ADS] [CrossRef] [Google Scholar]
- Baranne, A., Mayor, M., & Poncet, J. L. 1979, Vistas Astron., 23, 279 [NASA ADS] [CrossRef] [Google Scholar]
- Beavers, W. I., & Salzer, J. J. 1985, PASP, 97, 355 [NASA ADS] [CrossRef] [Google Scholar]
- Berger, J., Zins, G., Lazareff, B., et al. 2010, in Proc. SPIE, 7734, 99 [Google Scholar]
- Blind, N., Boffin, H. M. J., Berger, J. P., et al. 2011, A&A, 536, A55 [NASA ADS] [CrossRef] [EDP Sciences] [Google Scholar]
- Derekas, A., Kiss, L. L., Bedding, T. R., et al. 2006, ApJ, 650, L55 [NASA ADS] [CrossRef] [Google Scholar]
- Dumm, T., & Schild, H. 1998, New A, 3, 137 [Google Scholar]
- Eaton, J. A., & Barden, S. C. 1986, IBVS, 2952, 1 [NASA ADS] [Google Scholar]
- Eaton, J. A., & Barden, S. C. 1988, Acta Astron., 38, 353 [NASA ADS] [Google Scholar]
- Famaey, B., Pourbaix, D., Frankowski, A., et al. 2009, A&A, 498, 627 [NASA ADS] [CrossRef] [EDP Sciences] [Google Scholar]
- Fekel, F. C., Hinkle, K. H., Joyce, R. R., & Skrutskie, M. F. 2000a, AJ, 120, 3255 [NASA ADS] [CrossRef] [Google Scholar]
- Fekel, F. C., Joyce, R. R., Hinkle, K. H., & Skrutskie, M. F. 2000b, AJ, 119, 1375 [NASA ADS] [CrossRef] [Google Scholar]
- Gromadzki, M, Mikolajewska, J., Soszynski, I. 2013, Acta Astron, 63, 405 [Google Scholar]
- Hakkila, J., Myers, J. M., Stidham, B. J., & Hartmann, D. H. 1997, AJ, 114, 2042 [Google Scholar]
- Hall, D. S. 1990, AJ, 100, 554 [NASA ADS] [CrossRef] [Google Scholar]
- Henden, A., & Munari, U. 2008, Bal. Astron., 17, 293 [Google Scholar]
- Jorissen, A., & Mayor, M. 1992, A&A, 260, 115 [NASA ADS] [Google Scholar]
- Jorissen, A., Mayor, M., Manfroid, J., & Sterken, C. 1992, IBVS, 3720, 1 [Google Scholar]
- Jorissen, A., Frankowski, A., Famaey, B., & van Eck, S. 2009, A&A, 498, 489 [NASA ADS] [CrossRef] [EDP Sciences] [Google Scholar]
- Hurley, J. R., Pols, O. R., & Tout, C. A. 2000, MNRAS, 315, 543 [NASA ADS] [CrossRef] [Google Scholar]
- Jorissen, A., Van Eck, S., Mayor, M., & Udry, S. 1998, A&A, 332, 877 [NASA ADS] [Google Scholar]
- Kenyon, S. J., Proga, D., & Keyes, C. D. 2001, AJ, 122, 349 [NASA ADS] [CrossRef] [Google Scholar]
- Kerschbaum, F., Lebzelter, T., & Mekul, L. 2010, A&A, 524, A87 [NASA ADS] [CrossRef] [EDP Sciences] [Google Scholar]
- Komonjinda, S., Hearnshaw, J. B., & Ramm, D. J. 2011, MNRAS, 410, 1761 [NASA ADS] [Google Scholar]
- Le Bouquin, J.-B., Berger, J.-P., Lazareff, B., et al. 2011, A&A, 535, A67 [NASA ADS] [CrossRef] [EDP Sciences] [Google Scholar]
- Lindegren, L., Babusiaux, C., Bailer-Jones, C., et al. 2008, IAU Symp., 248, 217 [NASA ADS] [Google Scholar]
- Lines, R. D., Boyd, L. J., Genet, R. M., & Hall, D. S. 1984, IBVS, 2589, 1 [NASA ADS] [Google Scholar]
- Lucke, P. B., & Mayor, M. 1982, A&A, 105, 318 [NASA ADS] [Google Scholar]
- Mikołajewska, J. 2007, Baltic Astron., 16, 1 [Google Scholar]
- Mikołajewska, J. 2010 [arXiv:1011.5657] [Google Scholar]
- Mikołajewska, J. 2012, Baltic Astron., 21, 5 [Google Scholar]
- Mürset, U., & Schmid, H. M. 1999, A&AS, 137, 473 [NASA ADS] [CrossRef] [EDP Sciences] [Google Scholar]
- Podsiadlowski, P., & Mohamed, S. 2007, BaltA, 16, 26 [Google Scholar]
- Pojmanski, G. 1997, Acta Astron., 47, 467 [NASA ADS] [Google Scholar]
- Pourbaix, D. 2008, IAU Symp., 248, 59 [NASA ADS] [Google Scholar]
- Pourbaix, D., & Jorissen, A. 2000, A&AS, 145, 161 [NASA ADS] [CrossRef] [EDP Sciences] [Google Scholar]
- Raskin, G., van Winckel, H., Hensberge, H., et al. 2011, A&A, 526, A69 [NASA ADS] [CrossRef] [EDP Sciences] [Google Scholar]
- Ridgway, S. T., Joyce, R. R., White, N. M., & Wing, R. F. 1980, ApJ, 235, 126 [NASA ADS] [CrossRef] [Google Scholar]
- Rutkowski, A., Mikołajewska, J., & Whitelock, P. A. 2007, Baltic Astron., 16, 49 [Google Scholar]
- Samus, N. N. 1997, IBVS, 4501, 1 [Google Scholar]
- Soubiran, C., Le Campion, J.-F., Cayrel de Strobel, G., & Caillo, A. 2010, A&A, 515, A111 [NASA ADS] [CrossRef] [EDP Sciences] [Google Scholar]
- Tabur, V., Bedding, T. R., Kiss, L. L., et al. 2010, MNRAS, 409, 777 [NASA ADS] [CrossRef] [Google Scholar]
- Tallon-Bosc, I., Tallon, M., Thibaut, E., et al., 2008, SPIE 7013E, 44 [Google Scholar]
- Udry, S., Mayor, M., & Queloz, D. 1999, IAU Colloq. 170, Precise Stellar Radial Velocities, ASP Conf. Ser., 185, 367 [NASA ADS] [Google Scholar]
- van Belle, G. T., van Belle, G., Creech-Eakman, M. J., et al. 2008, ApJS, 176, 276 [NASA ADS] [CrossRef] [Google Scholar]
- Van Eck, S., & Jorissen, A. 2002, A&A, 396, 599 [NASA ADS] [CrossRef] [EDP Sciences] [Google Scholar]
- Van Eck, S., Jorissen, A., Udry, S., Mayor, M., & Pernier, B. 1998, A&A, 329, 971 [NASA ADS] [Google Scholar]
- van Leeuwen, F. 2007, A&A, 474, 653 [NASA ADS] [CrossRef] [EDP Sciences] [Google Scholar]
- van Leeuwen, F., & Evans, D. W. 1998, A&AS, 130, 157 [NASA ADS] [CrossRef] [EDP Sciences] [Google Scholar]
- Yi, S., Demarque, P., Kim, Y.-C., et al. 2001, ApJS, 136, 417 [NASA ADS] [CrossRef] [Google Scholar]
- Zamanov, R. K., Bode, M. F., Melo, C. H. F., et al. 2007, MNRAS, 380, 1053 [NASA ADS] [CrossRef] [Google Scholar]
All Tables
Revised orbital elements of V1261 Ori based on two new HERMES/Mercator measurements (see text).
Results of fitting the parameters for AG Peg, for three assumed values of the inclination i, in the range 30−90 degrees.
All Figures
|
Fig. 1 PIONIER squared visibilities for the stars HD 190658, HD 352, V1261 Ori, and ER Del as a function of the spatial frequency in 1/rad (×107). The data points are shown in red with error bars, while the uniform disc model that provides the best fit is indicated with blue solid dots. |
| In the text | |
|
Fig. 2 Same as Fig. 1 for the stars FG Ser (on 3 July and on 13 August 2012) and AG Peg. |
| In the text | |
|
Fig. 3 Squared visibilities for HD 352 as observed with PIONIER (red points with error bars), compared to a model with a uniform disc (blue dots; left panel) and an elongated Gaussian (right panel). The spatial frequency is given in 1/rad (×107). |
| In the text | |
|
Fig. 4 Model image of the elongated Gaussian that best fits the PIONIER visibilities for HD 352: the elongation ratio is 1.156 ± 0.026, the star is 1.38 × 1.6 mas wide, with the major axis position angle at 138 ± 4 degrees. |
| In the text | |
|
Fig. 5 The ASAS V lightcurve of V1261 Ori, phased with the orbital period of 638.24 d. |
| In the text | |
|
Fig. 6 The orbit of V1261 Ori, combining old CORAVEL measurements with recent HERMES/Mercator ones. |
| In the text | |
|
Fig. 7 The orbital solution for ER Del. The lower panel provides the O−C residuals. The error bars of the HERMES data points have been artificially increased to 0.3 km s-1. |
| In the text | |
|
Fig. 8 Hertzsprung-Russell diagram showing the positions of our target stars (full dots, in blue), together with Yonsei-Yale (Y2) evolutionary tracks for solar abundance stars with initial masses of 1, 1.5, and 3 M⊙. For FG Ser, ER Del, and AG Peg, we have only lower limits for the bolometric magnitude. The range for V1261 Ori is indicated with the red dashed line. For HD 190658, we indicate in magenta (open square) the value using the published and seemingly incorrect parallax (7.92 mas) and in green (full triangle) the value with our newly derived parallax. |
| In the text | |
|
Fig. 9 UV-plane coverage of our PIONIER observations for the stars HD 190658, HD 352, V1261 Ori, and ER Del. |
| In the text | |
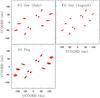 |
Fig. 10 Same as Fig. 9 for the stars FG Ser (on 3 July and 13 August 2012) and AG Peg. |
| In the text | |
|
Fig. 11 PIONIER closure phases for HD 352 (in degrees) as a function of the spatial frequency in 1/rad (×107). The data points are shown in red with error bars, while the model of an elongated disc with an additional punctual source that provides the best fit is indicated with blue solid dots. Given the error bars, the significance of these data, compared to zero closure phases, is very low, as all but three points do not deviate from zero more than the error bar. |
| In the text | |
|
Fig. 12 Reduced χ2 maps for HD 190658: shown is the reduced χ2 (logarithmic scale) as a function of the angular diameter (x-axis) and the relative flux level of the background (y-axis) based on our PIONIER data. These maps were computed using LITpro assuming a uniform disc plus background model. It is clear that the minimal reduced χ2 corresponds to the model without any added background. |
| In the text | |
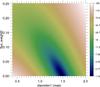 |
Fig. 13 Same as Fig. 12 for HD 352. |
| In the text | |
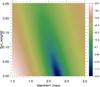 |
Fig. 14 Same as Fig. 12 for V1261 Ori. |
| In the text | |
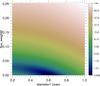 |
Fig. 15 Same as Fig. 12 for ER Del. |
| In the text | |
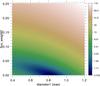 |
Fig. 16 Same as Fig. 12 for FG Ser as observed on 3 July 2012. |
| In the text | |
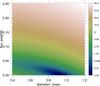 |
Fig. 17 Same as Fig. 12 for FG Ser as observed on 13 August 2012. |
| In the text | |
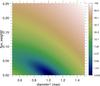 |
Fig. 18 Same as Fig. 12 for AG Peg. |
| In the text | |
Current usage metrics show cumulative count of Article Views (full-text article views including HTML views, PDF and ePub downloads, according to the available data) and Abstracts Views on Vision4Press platform.
Data correspond to usage on the plateform after 2015. The current usage metrics is available 48-96 hours after online publication and is updated daily on week days.
Initial download of the metrics may take a while.