| Issue |
A&A
Volume 564, April 2014
|
|
|---|---|---|
| Article Number | A32 | |
| Number of page(s) | 7 | |
| Section | Stellar structure and evolution | |
| DOI | https://doi.org/10.1051/0004-6361/201323055 | |
| Published online | 01 April 2014 | |
Research Note
Submillimeter Array observations of the proto brown dwarf candidate SSTB213 J041757 ⋆,⋆⋆
1
Department of PhysicsHCM International University-VNU,
Block 6, Linh Trung Ward, Thu Duc
District,
Ho Chi Minh City,
Vietnam
e-mail:
This email address is being protected from spambots. You need JavaScript enabled to view it.
2
Institute of Astronomy and Astrophysics, Academia Sinica,
PO Box 23-141,
106
Taipei,
Taiwan
3
Centro de Astrobiologia (CAB-CSIC), Ctra. Ajalvir km 4, 28850
Torrejón de Ardoz, Madrid, Spain
4
Harvard-Smithsonian Center for Astrophysics,
Cambridge MA 02/138,
USA
Received:
15
November
2013
Accepted:
27
February
2014
Abstract
Context. The previously identified source SSTB213 J041757 is a proto brown dwarf candidate in Taurus, which has two possible components A and B. It was found that component B is probably a class 0/I proto brown dwarf associated with an extended envelope.
Aims. Studying molecular outflows from young brown dwarfs provides important insight into brown dwarf formation mechanisms, particularly brown dwarfs at the earliest stages such as class 0, I. We therefore conducted a search for molecular outflows from SSTB213 J041757.
Methods. We observed SSTB213 J041757 with the Submillimeter Array to search for CO molecular outflow emission from the source.
Results. Our CO maps do not show any outflow emission from the proto brown dwarf candidate.
Conclusions. The non-detection implies that the molecular outflows from the source are weak; deeper observations are therefore needed to probe the outflows from the source.
Key words: ISM: jets and outflows / brown dwarfs / techniques: interferometric / stars: formation
Appendix A is available in electronic form at http://www.aanda.org
SMA data cutes (FITS format) are only available at the CDS via anonymous ftp to cdsarc.u-strasbg.fr (130.79.128.5) or via http://cdsarc.u-strasbg.fr/viz-bin/qcat?J/A+A/564/A32
© ESO, 2014
1. Introduction
Since molecular outflows are a basic component of the star formation process, studying the molecular outflow properties will help us understand the star formation mechanism. For brown dwarfs (BD), some observations have been carried out in the past few years to characterize jets and molecular outflows in class II BDs, very low-mass (VLM) stars (Whelan et al. 2005; Phan-Bao et al. 2008; 2011), and proto BD candidates (Bourke et al. 2005; Kauffmann et al. 2011). These observations have suggested that the outflow process occurs in BDs as a scaled-down version of that in low-mass stars, providing additional evidence that BDs form like stars. However, it is still unclear how this physical process occurs at earlier stages, such as at classes 0, I of the BD formation process, because we lack identification and studies of BDs at these classes. Therefore, observations of molecular outflows from BDs at these earliest stages are clearly important to complete our understanding of BD formation mechanism. These observations will also provide strong constraints on BD formation theory (e.g., Machida et al. 2009).
Taurus is a nearby star-forming region (~145 pc) where many class II BDs have been identified and studied. The region is therefore a good target to study the BD formation process. For class II BDs and VLM stars, Phan-Bao et al. (2011) have reported the first detection of a bipolar molecular outflow from MHO 5, a VLM star of 90 MJ. The molecular outflow from MHO 5 shows similar properties as seen in ISO-Oph 102 (a young BD in ρ Ophiuchi, Phan-Bao et al. 2008) such as low-velocity (<5 km s-1), compact structure (500−1000 AU), small outflow mass (10-6−10-3 M⊙), and low mass-loss rate (10-10−10-6 M⊙ yr-1). For BDs at ealier classes, Barrado et al. (2009) have reported the detection of a proto BD candidate SSTB213 J041757 (hereafter J041757) with two possible components, SSTB213 J041757 A and SSTB213 J041757 B (hereafter J041757-A and J041757-B). Luhman et al. (2010) spectroscopically classified J041757-A as an M2 background dwarf star and suggested that the proper motion of J041757-B is inconsistent with membership in Taurus. Palau et al. (2012) recently reported a detection of centimeter continuum emission at the position of J041757-B, which is attributed to thermal free-free emission due to shocks in the jet of J041757-B driven by a central object. The detection has implied that J041757-B might be a proto BD. J041757-B is therefore a good target for our ongoing program of characterizing molecular outflows in the substellar domain. We thus conducted a search for molecular outflows from the proto BD candidate with the Submillimeter Array (SMA). This paper presents our millimeter observations of J041757 and discusses the nature of the source.
SMA observing log for SSTB213 J041757.
2. Observation and data reduction
We observed J041757 at 230 GHz with SMA1 (Ho et al. 2004) on 2012 November 21. However, the weather was bad because zenith opacities at 225 GHz were above 0.4 during the observations. Therefore, we re-observed the target on 2012 November 24 with zenith opacities at 225 GHz in the range 0.12–0.26. The observing log is given in Table 1. The two 4 GHz-wide sidebands, which are separated by 8 GHz, were used. The SMA correlator was configured with high spectral resolution bands of 512 channels per chunk of 104 MHz for 12CO, 13CO, and C18O J = 2–1 lines, giving a channel spacing of 0.27 km s-1. A lower resolution of 3.25 MHz per channel was set up for the remainder of each sideband. The quasars 3C 111 and 3C 84 were observed for gain calibration and 3C 279 for passband calibration. Uranus was used for flux calibration of the target. The uncertainty in the absolute flux calibration is about 10%.
We used the MIR software package and the MIRIAD package adapted for the SMA for data calibration and analysis, respectively. All eight antennas in the compact configuration results in a synthesized beam of 3.̋34 × 2.̋79 with a position angle of 30° using the natural weighting. The primary FWHM beam is about 50″ at the observed frequencies. The rms sensitivity was about 1 mJy for the continuum, using both sidebands, and ~0.15 Jy beam-1 per channel for the line data.
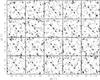 |
Fig. 1 Velocity channel maps of the 12CO J = 2–1 emission in the region of the proto BD candidate J041757-B, from ~0 to 15 km s-1 with a spacing of 0.8 km s-1. The position of J041757-B is indicated by the cross mark. The LSR velocity is indicated in the upper left corner of each panel. The contour level starts from 2σ, with σ = 0.09 Jy/beam. The arrow indicates the expected outflow direction of about 40°, as suggested in Palau et al. (2012). The synthesized beam is shown in the bottom left corner of the first panel. |
 |
Fig. 2 3.6 and 6.0 cm luminosity vs. bolometric luminosity for proto stars, data from Furuya et al. (2003), Eiroa et al. (2005) and references therein. Three proto BD candidates IRAM 04191+1522, L1014-IRS and J041757-B are also plotted with centimeter flux from André et al. (1999), Shirley et al. (2007), Palau et al. (2012); the distance and bolometric luminosity for IRAM 04191+1522 and L1014-IRS are taken from Maheswar et al. (2011), an average distance of 145 ± 5 pc is used for J041757-B (e.g., Loinard et al. 2007). The dashed line represents the correlations given in Shirley et al. (2007). |
3. Discussion
Based on IRAC/Spitzer color–color and color–magnitude diagrams, Barrado et al. (2009) classified J041757 as a class 0/I proto BD candidate because the position of J041757 lies in the locus of class 0/I objects in the diagrams. Optical and near-infrared images have shown that J041757 has two possible components A and B. The resemblance in spectral energy distribution (SED) between J041757 and the very low luminosity object L1014-IRS (Young et al. 2004, Bourke et al. 2005), which is a class 0/I proto BD candidate, suggests that J041757 is also a class 0/I proto BD candidate (see Fig. 3 in Barrado et al. 2009).
Using near-infrared spectroscopy, Luhman & Mamajek (2010) classified J041757-A as an M2 background dwarf star because of the absence of strong H2O absorption bands in its spectrum as seen in young late-M dwarfs. For the remaining component J041757-B, the source was too weak to obtain a spectrum.
Barrado et al. (2009) detected unresolved radio continuum emission with VLA at 6 cm from the position of J041757. With higher angular resolution observations, Palau et al. (2012) recently reported radio continuum emission detected at 3.6 cm (0.19 ± 0.11 mJy) and 6 cm (0.20 ± 0.05 mJy), and the emission is only associated with J041757-B; J041757-A shows no radio emission. Palau and collaborators also found that the emission is not polarized with a flat spectral index in the range of 6−3.6 cm. This suggests that the mechanism of centimeter continuum emission is thermal free-free emission caused by shocks in the jet driven by the central object (see Palau et al. 2012, and references therein). The authors concluded that the emission is not consistent with the centimeter emission from AGNs, which is typically produced by synchrotron emission (from relativistic accelerated electrons).
If J041757-B is driving a radio jet, molecular outflows, which are ambient gas swept up by the jet, are expected. The Palau et al. (2012) observations of 12CO J = 1–0 and 13CO J = 1–0 (see their Fig. 4) suggested that molecular outflow emission from J041757-B would be detectable in the range of 4.5−7.5 km s-1. However, our observations do not reveal any outflow emission from the region of J041757-B. Figure 1 presents the velocity channel maps of 12CO J = 2–1 emission in the region of J041757-B. No CO outflow emission is detected in the velocity range of 0−15 km s-1. In addition, no 13CO J = 2–1 and C18O J = 2–1 are detected in the same region (see Figs. A.1 and A.2). These non-detections indicate two possible scenarios:
-
1.
We consider the first possible scenario that J041757-B is abackground object behind Taurus. The flat spectral index of radioemission as reported in Palau et al. (2012) supportsthe scenario that the source is a galactic object and not a galaxy. Toestimate the distance of J041757-B, we used the extinction law asgiven in Mathis (1990) withRV = 3.1 and then dereddened apparent magnitudes from Barrado et al. (2009). Dereddenning the i and J-band magnitudes of J041757-A with AV = 5 gives a color index i − J = 2.2, in good agreement with the color of an M2 dwarf (West et al. 2005). At this point, we derive a distance of about 670 pc for J041757-A. Our AV estimate is consistent with the Palau et al. values. With AV = 5, we obtain dereddened magnitudes, i = 19.81, J = 17.74, H = 17.16 and KS = 16.26 for J041757-B. The i and z-band magnitudes for J041757-A measured with MegaCam/CFHT (Barrado et al. 2009) agree well with those from SDSS (DR9), suggesting that the iz photometry of MegaCam/CFHT and SDSS is similar (as also pointed out in Luhman & Mamajek 2010). We therefore used color transformations between SDSS and Johnson-Cousins as given in Jordi et al. (2006) to calculate I-Cousins magnitude for J041757-B and derive IC = 19.20. The color IC − J = 1.46 is consistent with an M4-M5 red giant (e.g., Bessell & Brett 1988). Comparison of the J, H and K-band magnitudes of J041757-B with the J, H, K-band absolute magnitudes of an M4 giant (Thé et al. 1990) gives an average distance of about 340 kpc for J041757-B, significantly larger than the currently known extent of our Galaxy as discussed in Palau et al. (2012). The source J041757-B might be a variable giant star, thus its photometric variability along with high extinction might cause a large uncertainty in estimating distances and spectral type. However, the K-band magnitudes measured at three different epochs do not show any significant variability of the source: K = 16.95 ± 0.08 (UKIDSS-DR62, epoch = 2005.968), K = 16.79 ± 0.04 (UKIDSS-DR8, epoch = 2010.077) and KS = 16.81 ± 0.03 (Barrado et al. 2009, epoch = 2007.844). All these measurements agree well within error bars and the difference of about 0.1 mag between the WFCAM and 2MASS photometric systems (Hewett et al. 2006).
-
2.
The second possible scenario is that molecular outflows from J041757-B are too weak to be detectable with SMA. Palau et al. (2012) reported a detection of blueshifted emission at velocities in the range 2−4 km s-1 for 12CO J = 1–0 (see their Figs. 4 and 5), which possibly comes from an outflow. From Figs. 4 and 5 of Palau and collaborators, we estimate its brightness temperature to be about 1 K or ~5.3 Jy/beam (for a beam size of 22″). This corresponds to 0.09 Jy/beam (for an SMA beam size of 3″), giving a detection level of only ~1σ for our 12CO J = 2–1 observations in the same velocity range if we assume that the CO J = 2–1/J = 1–0 ratio is 1. The detection level of 13CO J = 2–1 outflows were estimated in the same manner. The brightness temperature of redshifted 13CO J = 1–0 emission (e.g., 6.5−7.5 km s-1, see Fig. 5 of Palau et al. 2012) is about 3 K or ~12.0 Jy/beam (for a beam size of 22″). This corresponds to 0.22 Jy/beam (for an SMA beam size of 3″), giving a detection level of ~2σ for our 13CO J = 2–1 observations. This therefore could explain our non-detections of 12CO J = 2–1 and 13CO J = 2–1 emission. Moreover, J041757-B and L1014-IRS share similar SEDs but the latter source shows outflow emission detected by SMA (Bourke et al. 2005). First, this is possibly because the gas in the Taurus region around J041757-B is much less dense (i.e., weaker outflow emission) than that around L1014-IRS. The estimated visual extinction AV ~ 25 of L1014-IRS (Huard et al. 2006), which is significantly greater than the extinction AV ~ 5 of J041757-B (see above), supports this possibility. Second, the bolometric luminosity of J041757-B (0.003 L⊙, Barrado et al. 2009) is 50 times less luminous than that of L1014-IRS (0.15 L⊙, 258 pc, Maheswar et al. 2011). If we assume that the outflow force vs. bolometric luminosity correlation of proto stars (e.g., Takahashi & Ho 2012) is applicable for proto BDs, this implies that the outflow force in J041757-B would be much weaker (i.e., weaker molecular outflow emission) than in L1014-IRS. With such a very low bolometric luminosity (0.003 L⊙), the centimeter luminosities of J041757-B appear unusual, however. Figure 2 shows the 3.6 and 6.0 cm luminosity vs. bolometric luminosity diagram for proto stars (Lbol ≤ ~ 103 L⊙, low-mass and intermediate-mass protostellar sources, see also Shirley et al. 2007 and references therein) as well as three proto BD candidates, J041757-B, L1014-IRS and IRAM 04191+1522 (0.07 L⊙, Maheswar et al. 2011). The rms dispersions of the proto stars around the cm luminosity vs. bolometric luminosity correlations as given in Shirley et al. (2007) are 0.37 and 0.47 for 3.6 cm and 6.0 cm luminosity, respectively. For L1014-IRS and IRAM 04191+1522, the deviations from the correlations appear larger than the rms dispersions, but they are still in the range of dispersion of the proto stars, 0.02−0.89 for 3.6 cm and 0.03−1.1 for 6.0 cm luminosity. This suggests that the two proto BD candidates L1014-IRS and IRAM 04191+1522 follow the correlations of proto stars. However, observations of more proto BDs are needed to confirm this trend. For J041757-B, it is unlikely that the proto BD candidate follows the correlations of proto stars. With a much lower bolometric luminosity, the centimeter luminosities of J041757-B, however, are similar to those of L1014-IRS and IRAM 04191+1522 (Fig. 2). These values of J041757-B are about 1.6 (for 3.6 cm luminosity) and 2.3 (for 6.0 cm luminosity) orders of magnitude brighter than the expected luminosities, which are estimated from the correlations in Shirley et al. (2007) at the given bolometric luminosity of J041757-B. This suggests that J041757-B possibly has two components of centimeter emission as observed in L1014-IRS (Shirley et al. 2007), a steady thermal component and a variable nonthermal component. The contribution of the latter one to the centimeter emission could significantly change the luminosities of the proto BD candidate. More observations at different epochs are needed to study the variability of the source. Finally, we also measured 1.3 mm continuum emission at the position of J041757-B with an upper limit of 1 mJy. Our measurement agrees with that from Barrado et al. (2009), who reported a value of <2.88 mJy at 1.2 mm. Using the relation between the millimeter continuum emission and the mass of compact gas and dust as given in Wilking et al. (1989) for a temperature of 20 K, we derive an upper limit of ~1 MJ to the disk mass of J041757-B.
4. Conclusion
We presented our SMA observations of the proto BD candidate J041757-B and discussed two possible scenarios on the nature of the source: a proto BD in Taurus and a background giant. Based on our observations and currently available data, we conclude that the molecular outflows from the proto BD candidate are weak, therefore, more sensitive radio observations are required to explore the outflows and the dense envelope/core associated with J041757-B to confirm its nature.
Online material
Appendix A: Velocity channel maps of the 13CO J = 2–1 and C18O J = 2–1 emission in the region of J041757-B
The Submillimeter Array is a joint project between the Smithsonian Astrophysical Observatory and the Academia Sinica Institute of Astronomy and Astrophysics and is funded by the Smithsonian Institution and the Academia Sinica.
Acknowledgments
N.P.-B. has been supported by Viet Nam NAFOSTED grant 103.08-2010.17. E.M. has been supported by the Spanish Ministry of Economy and Competitiveness (MINECO) under grant AyA2011-30147-C03-03 and wishes to thank the Geosciences Department at the University of Florida for a visiting appointment. We also thank the referee for valuable comments. This work is based in part on data obtained as part of the UKIRT Infrared Deep Sky Survey and has made use of the Centre de Données astronomiques de Strasbourg (CDS) database.
References
- André, P., Motte, F., & Bacmann, A. 1999, ApJ, 513, L57 [NASA ADS] [CrossRef] [Google Scholar]
- Bessell, M. S., & Brett, J. M. 1988, PASP, 100, 1134 [NASA ADS] [CrossRef] [Google Scholar]
- Barrado, D., Morales-Calderón, M., Palau, A., et al. 2009, A&A, 508, 859 [NASA ADS] [CrossRef] [EDP Sciences] [Google Scholar]
- Bourke, T. L., Crapsi, A., Myers, P. C., et al. 2005, ApJ, 633, L129 [NASA ADS] [CrossRef] [Google Scholar]
- Eiroa, C., Torrelles, J. M., Curiel, S., & Djupvik, A. A. 2005, AJ, 130, 643 [NASA ADS] [CrossRef] [Google Scholar]
- Furuya, R. S., Kitamura, Y., Wootten, A., Claussen, M. J., & Kawabe, R. 2003, ApJS, 144, 71 [NASA ADS] [CrossRef] [Google Scholar]
- Hewett, P. C., Warren, S. J., Leggett, S. K., & Hodgkin, S. T. 2006, MNRAS, 367, 454 [NASA ADS] [CrossRef] [Google Scholar]
- Ho, P. T. P., Moran, J. M., & Lo, K. Y. 2004, ApJ, 616, L1 [NASA ADS] [CrossRef] [Google Scholar]
- Huard, T. L., Myers, P. C., Murphy, D. C., et al. 2006, ApJ, 640, 391 [NASA ADS] [CrossRef] [Google Scholar]
- Jordi, K., Grebel, E. K., & Ammon, K. 2006, A&A, 460, 339 [NASA ADS] [CrossRef] [EDP Sciences] [Google Scholar]
- Kauffmann, J., Bertoldi, F., Bourke, T. L., et al. 2011, MNRAS, 416, 2341 [NASA ADS] [CrossRef] [Google Scholar]
- Loinard, L., Torres, R. M., Mioduszewski, A. J., et al. 2007, ApJ, 671, 546 [NASA ADS] [CrossRef] [Google Scholar]
- Luhman, K. L., & Mamajek, E. E. 2010, ApJ, 716, L120 [NASA ADS] [CrossRef] [Google Scholar]
- Machida, M. N., Inutsuka, S., & Matsumoto, T. 2009, ApJ, 699, L157 [NASA ADS] [CrossRef] [Google Scholar]
- Maheswar, G., Lee, C. W., & Dib, S. 2011, A&A, 536, A99 [NASA ADS] [CrossRef] [EDP Sciences] [Google Scholar]
- Mathis, J. S. 1990, ARA&A, 28, 37 [NASA ADS] [CrossRef] [Google Scholar]
- Palau, A., de Gregorio-Monsalvo, I., Morata, Ò., et al. 2012, MNRAS, 424, 2778 [NASA ADS] [CrossRef] [Google Scholar]
- Phan-Bao, N., Riaz, B., Lee, C.-F., et al. 2008, ApJ, 689, L141 [NASA ADS] [CrossRef] [Google Scholar]
- Phan-Bao, N., Lee, C.-F., Ho, P. T. P., & Tang, Y.-W. 2011, ApJ, 735, 14 [NASA ADS] [CrossRef] [Google Scholar]
- Shirley, Y. L., Claussen, M. J., Bourke, T. L., Young, C. H., & Blake, G. A. 2007, ApJ, 667, 329 [NASA ADS] [CrossRef] [Google Scholar]
- Takahashi, S., & Ho, P. T. P. 2012, ApJ, 745, L10 [NASA ADS] [CrossRef] [Google Scholar]
- Thé, P. S., Thomas, D., Christensen, C. G., & Westerlund, B. E. 1990, PASP, 102, 565 [NASA ADS] [CrossRef] [Google Scholar]
- West, A. A., Walkowicz, L. M., & Hawley, S. L. 2005, PASP, 117, 706 [NASA ADS] [CrossRef] [Google Scholar]
- Whelan, E. T., Ray, T. P., Bacciotti, F., et al. 2005, Nature, 435, 652 [NASA ADS] [CrossRef] [PubMed] [Google Scholar]
- Wilking, B. A., Mundy, L. G., Blackwell, J. H., & Howe, J. E. 1989, ApJ, 345, 257 [NASA ADS] [CrossRef] [Google Scholar]
- Young, C. H., Jørgensen, J. K.,Shirley, Y. L., et al. 2004, ApJS, 154, 396 [NASA ADS] [CrossRef] [Google Scholar]
All Tables
All Figures
|
Fig. 1 Velocity channel maps of the 12CO J = 2–1 emission in the region of the proto BD candidate J041757-B, from ~0 to 15 km s-1 with a spacing of 0.8 km s-1. The position of J041757-B is indicated by the cross mark. The LSR velocity is indicated in the upper left corner of each panel. The contour level starts from 2σ, with σ = 0.09 Jy/beam. The arrow indicates the expected outflow direction of about 40°, as suggested in Palau et al. (2012). The synthesized beam is shown in the bottom left corner of the first panel. |
| In the text | |
|
Fig. 2 3.6 and 6.0 cm luminosity vs. bolometric luminosity for proto stars, data from Furuya et al. (2003), Eiroa et al. (2005) and references therein. Three proto BD candidates IRAM 04191+1522, L1014-IRS and J041757-B are also plotted with centimeter flux from André et al. (1999), Shirley et al. (2007), Palau et al. (2012); the distance and bolometric luminosity for IRAM 04191+1522 and L1014-IRS are taken from Maheswar et al. (2011), an average distance of 145 ± 5 pc is used for J041757-B (e.g., Loinard et al. 2007). The dashed line represents the correlations given in Shirley et al. (2007). |
| In the text | |
 |
Fig. A.1 Same as Fig. 1 for the 13CO J = 2–1 emission, with σ = 0.085 Jy/beam. |
| In the text | |
 |
Fig. A.2 Same as Fig. 1 for the C18O J = 2–1 emission, with σ = 0.083 Jy/beam. |
| In the text | |
Current usage metrics show cumulative count of Article Views (full-text article views including HTML views, PDF and ePub downloads, according to the available data) and Abstracts Views on Vision4Press platform.
Data correspond to usage on the plateform after 2015. The current usage metrics is available 48-96 hours after online publication and is updated daily on week days.
Initial download of the metrics may take a while.