Fig. 7
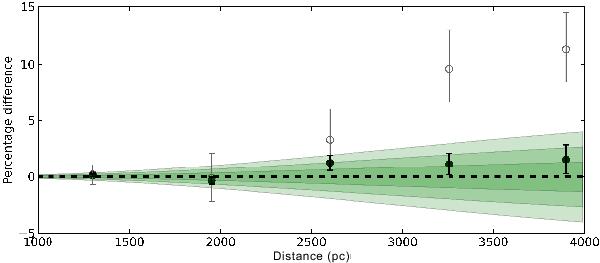
Results of the distance estimation to a simulated Pleiades-like cluster placed at a factor of 10 to 30 times the original distance. Filled circles show the percentage difference between the MLE-estimated distances and the true distance, open circles are the percentage difference between the inverse of the mean of the parallax and the true distance, and green shading highlights 1, 2, and 3σ errors extrapolated over the entire range.
Current usage metrics show cumulative count of Article Views (full-text article views including HTML views, PDF and ePub downloads, according to the available data) and Abstracts Views on Vision4Press platform.
Data correspond to usage on the plateform after 2015. The current usage metrics is available 48-96 hours after online publication and is updated daily on week days.
Initial download of the metrics may take a while.