Fig. 7
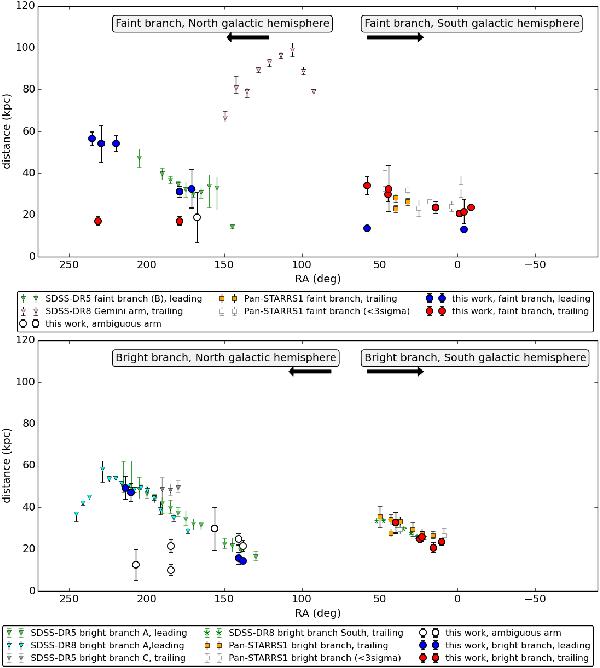
Photometric main sequence turnoff point distances for the Sagittarius stream along right ascension (northern-leading tail and southern- trailing tail). The top panel shows results for the faint branch, whereas the bottom panel corresponds to the bright arm. Our data (blue circles for leading tails and red circles for trailing tails) are based on the theoretical isochrones by Marigo et al. (2008) and the corrections by Girardi et al. (2010), for a 10.2 Gyr old stellar population with [Fe/H] = −1.0. Other distance values correspond to Belokurov et al. (2006, green and grey triangles), Koposov et al. (2012, 2013, green asterisks), Belokurov et al. (2014, pink triangles) and Slater et al. (2013, yellow squares for >3σ detections and white squares for <3σ). White circles denote detections that can not be unambiguously tagged as leading or trailing.
Current usage metrics show cumulative count of Article Views (full-text article views including HTML views, PDF and ePub downloads, according to the available data) and Abstracts Views on Vision4Press platform.
Data correspond to usage on the plateform after 2015. The current usage metrics is available 48-96 hours after online publication and is updated daily on week days.
Initial download of the metrics may take a while.