Fig. 5
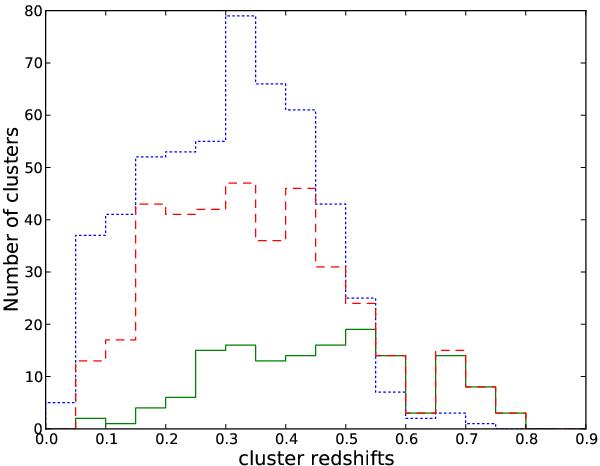
Distribution of measured spectroscopic redshifts of the cluster sample associated with LRGs that have spectra is presented by the red dashed line, and a subsample of it based only on BOSS data is indicated by the green solid line, while the redshift distribution of the optically confirmed cluster sample in Paper II is presented by the blue dotted line.
Current usage metrics show cumulative count of Article Views (full-text article views including HTML views, PDF and ePub downloads, according to the available data) and Abstracts Views on Vision4Press platform.
Data correspond to usage on the plateform after 2015. The current usage metrics is available 48-96 hours after online publication and is updated daily on week days.
Initial download of the metrics may take a while.