Fig. 3
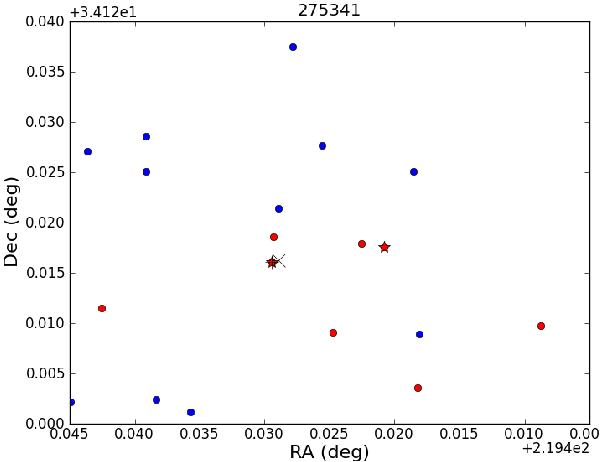
Distribution on the sky of the cluster member candidates (red dots) and field galaxies (blue dots) within 500 kpc (~1.3 arcmin) from the X-ray position (marked by a black cross) of the example cluster, 2XMMi J143742.9+340810. Note the different scale in Fig. 4. The cluster galaxies with available zs are marked by stars. The BCG candidate is marked by a black plus that has a projected separation from the X-ray position of ~11 kpc. We only present galaxies with mr ≤ 22.2 mag, △ mr < 0.5 mag, and △ zp / zp < 0.5.
Current usage metrics show cumulative count of Article Views (full-text article views including HTML views, PDF and ePub downloads, according to the available data) and Abstracts Views on Vision4Press platform.
Data correspond to usage on the plateform after 2015. The current usage metrics is available 48-96 hours after online publication and is updated daily on week days.
Initial download of the metrics may take a while.