Fig. 2
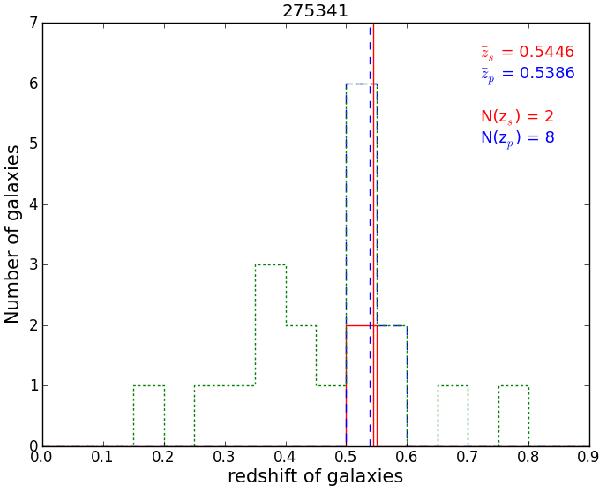
Histogram of the spectroscopic (zs, red solid) and photometric (zp, blue dashed) redshifts of the cluster member candidates (Nzs and Nzp) within 500 kpc of the example cluster, 2XMMi J143742.9+340810. The green dotted histogram represents the distribution of zp of field galaxies within the same region. The cluster spectroscopic  and photometric
  redshifts are represented by red solid and blue dashed vertical lines, respectively, and are listed in the upper corner.
Current usage metrics show cumulative count of Article Views (full-text article views including HTML views, PDF and ePub downloads, according to the available data) and Abstracts Views on Vision4Press platform.
Data correspond to usage on the plateform after 2015. The current usage metrics is available 48-96 hours after online publication and is updated daily on week days.
Initial download of the metrics may take a while.