Free Access
Fig. 14
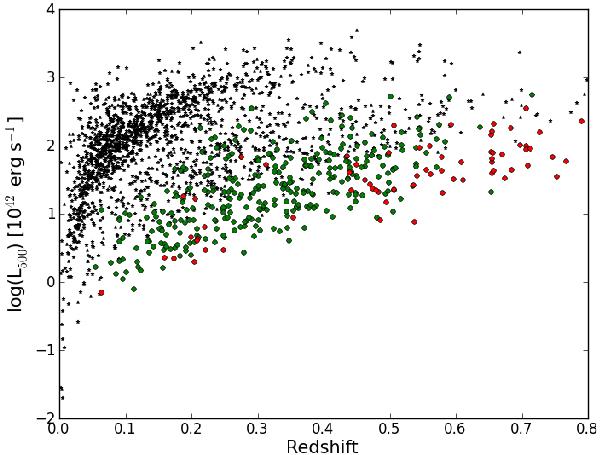
Distribution of the X-ray bolometric luminosities, L500, with redshift of the new cluster sample (red dots) from the current procedure, the cluster sample in common with Paper II (green dots), and a sample of 1730 clusters (black stars) below redshift 0.8 detected from ROSAT data (Piffaretti et al. 2011).
Current usage metrics show cumulative count of Article Views (full-text article views including HTML views, PDF and ePub downloads, according to the available data) and Abstracts Views on Vision4Press platform.
Data correspond to usage on the plateform after 2015. The current usage metrics is available 48-96 hours after online publication and is updated daily on week days.
Initial download of the metrics may take a while.