Fig. C.1
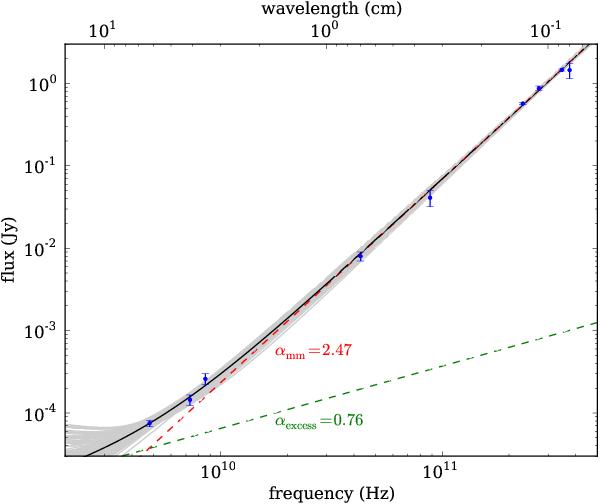
Long-wavelength SED of TW Hya, including the new 4.1-cm and 6.3-cm detection. The dashed lines denote the power law fits corresponding to the dust emission (red) and the radio continuum excess (green). The full line is the sum of the two contributions. In gray, a set of 100 models from the Monte Carlo resampling analysis is shown.
Current usage metrics show cumulative count of Article Views (full-text article views including HTML views, PDF and ePub downloads, according to the available data) and Abstracts Views on Vision4Press platform.
Data correspond to usage on the plateform after 2015. The current usage metrics is available 48-96 hours after online publication and is updated daily on week days.
Initial download of the metrics may take a while.