Free Access
Fig. 1
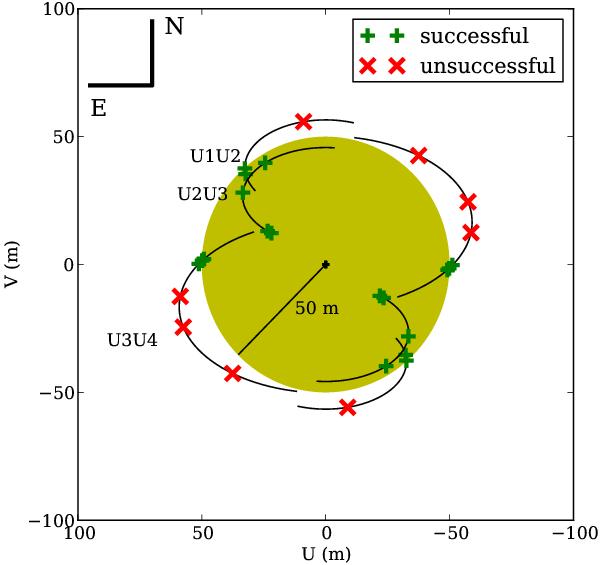
Uv-plot of all MIDI observations of TW Hya, distinguishing between the successful (green) and unsuccessful (red) fringe tracks. The curved tracks correspond to the different baselines, with the different names indicated. Clearly, the yellow area with a 50-m radius indicates the domain accessible with MIDI.
Current usage metrics show cumulative count of Article Views (full-text article views including HTML views, PDF and ePub downloads, according to the available data) and Abstracts Views on Vision4Press platform.
Data correspond to usage on the plateform after 2015. The current usage metrics is available 48-96 hours after online publication and is updated daily on week days.
Initial download of the metrics may take a while.