Fig. 9
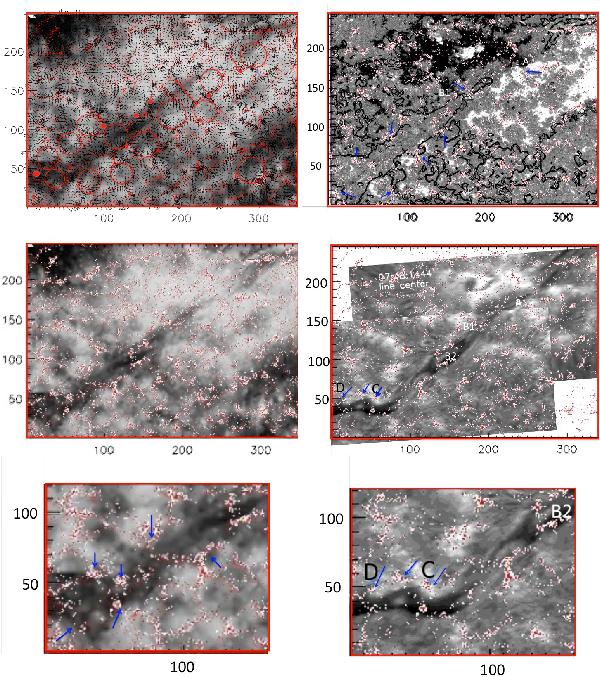
Zoom maps of the EUV filament channel observed with SDO/AIA 304 Å and the cork distribution (red-white dots) overlaid by the horizontal proper photospheric velocity field (arrows) after taking out the differential rotation (left top panel), the same data without the overlay of the velocity field for a better visibility (left middle panel). The red circles indicate some supergranules, and the large red dots indicate the locations of convergence velocity vectors at the edges of the filament channel in the top left panel. Right top panel: magnetic map overlaid by the EUV filament contour and the cork distribution. Middle and bottom right panels: Hα images (MSDP) (presented in Fig. 2) overlaid by the cork distribution. Blue arrows indicate the accumulation of corks at the edges of the EUV filament (bottom left panel) and close to the Hα feet C and D (bottom right panel). The unit of the coordinates are in arcsec.
Current usage metrics show cumulative count of Article Views (full-text article views including HTML views, PDF and ePub downloads, according to the available data) and Abstracts Views on Vision4Press platform.
Data correspond to usage on the plateform after 2015. The current usage metrics is available 48-96 hours after online publication and is updated daily on week days.
Initial download of the metrics may take a while.