Fig. 7
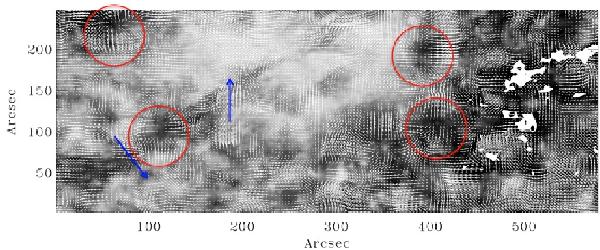
Proper velocity vector map integrated over 3 h detected in the SDO/HMI images with a spatial resolution of 56 arcsec computed by the CST algorithm overlying the 304 Å SDO/AIA image at 11:55 UT. The supergranules (red circles) are represented by divergence flows from their center. We see, in two locations, velocity vectors going in a direction perpendicular to the filament channel. It looks like flows are crossing the channel (blue arrows). The white spots on the right are saturated points where the computation cannot be done.
Current usage metrics show cumulative count of Article Views (full-text article views including HTML views, PDF and ePub downloads, according to the available data) and Abstracts Views on Vision4Press platform.
Data correspond to usage on the plateform after 2015. The current usage metrics is available 48-96 hours after online publication and is updated daily on week days.
Initial download of the metrics may take a while.