Fig. 6
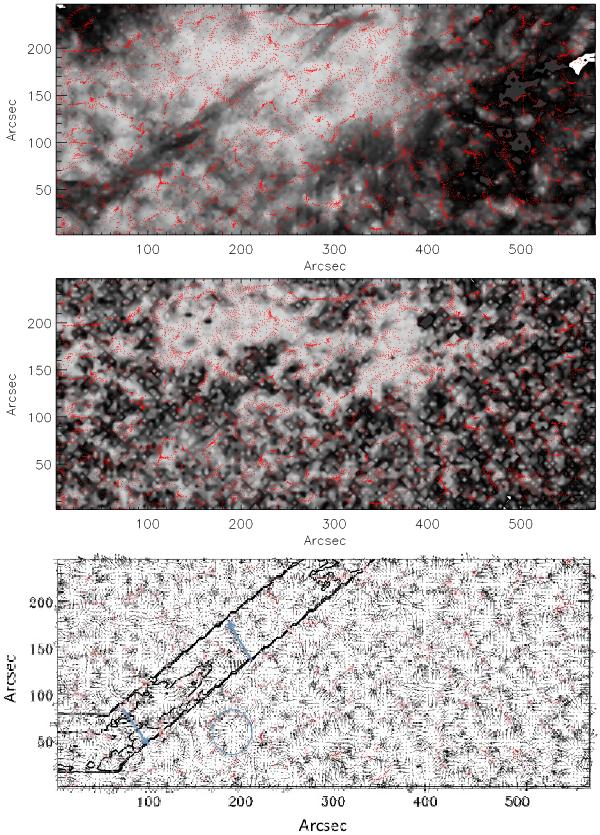
Distribution of the passive scalar “corks” (red dots) in the filament environment after 14:30 UT derived by using the mean photospheric motion velocity obtained over 3 h superimposed on respectively an SDO/AIA image 304 Å at 11:55 UT (top panel) and at 1600 Å (middle panel), proper velocity vector map integrated over 3 h and detected in the SDO/HMI images with a spatial resolution of 3.5 arcsec using the CST method overlaid by a contour of the 304 Å filament in a schematic channel (bottom panel). The corks are accumulated at the borders of the diverging flows in regions of convergence. They are concentrated in the supergranule boundaries (like the blue circle). Two blue arrows indicate two alignments of vectors crossing the filament channel. The origin of the graphs corresponds approximatively to the point (−250, −525) in the solar coordinates of Fig. 1.
Current usage metrics show cumulative count of Article Views (full-text article views including HTML views, PDF and ePub downloads, according to the available data) and Abstracts Views on Vision4Press platform.
Data correspond to usage on the plateform after 2015. The current usage metrics is available 48-96 hours after online publication and is updated daily on week days.
Initial download of the metrics may take a while.