Fig. 11
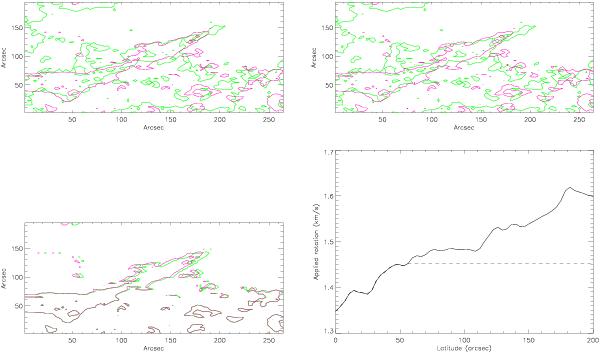
Top left panel: filament contour of the SDO/AIA 304 Å at 08:55 UT after applying the measured nominal differential rotation rate during 14.5 h (pink contour). The green contour is the contour of the filament drawn in the image 304 Å at 23:34 UT in both top panels. The superposition of both contours in the top left panel are in good agreement despite the filament evolution. Top right panel: filament contour of the SDO/AIA image 304 Å at 08:55 UT, after applying a second model of differential rotation rate, blocked for latitudes greater than 56 arcsec during 14.5 h (pink contour). The abscissae/ordinates of the top panels and the left bottom panel are the longitude/latitude. The origin of the latitudes in arcsec corresponds approximatively to x = −350 arcsec, y = −575 arcsec in Fig. 1. The superposition of the resulting images with the filament contour at 23:32 UT shows that the filament is clearly extended toward the West by the nominal differential rotation rate. Bottom left panel: the comparison of the contours of the filament with the two different rotation rates (green for the nominal differential rotation and pink for the blocked differential rotation) shows this extension. Bottom right panel: the two models of differential rotation rate. The solid line is computed for all the latitudes with the CST method. The dashed line is the blocked differential rotation rate for latitudes higher than 56 arcsec.
Current usage metrics show cumulative count of Article Views (full-text article views including HTML views, PDF and ePub downloads, according to the available data) and Abstracts Views on Vision4Press platform.
Data correspond to usage on the plateform after 2015. The current usage metrics is available 48-96 hours after online publication and is updated daily on week days.
Initial download of the metrics may take a while.